Immigrants from Sierra Leone vs Estonian Householder Income Ages 25 - 44 years
COMPARE
Immigrants from Sierra Leone
Estonian
Householder Income Ages 25 - 44 years
Householder Income Ages 25 - 44 years Comparison
Immigrants from Sierra Leone
Estonians
$93,115
HOUSEHOLDER INCOME AGES 25 - 44 YEARS
30.9/ 100
METRIC RATING
188th/ 347
METRIC RANK
$107,269
HOUSEHOLDER INCOME AGES 25 - 44 YEARS
99.9/ 100
METRIC RATING
47th/ 347
METRIC RANK
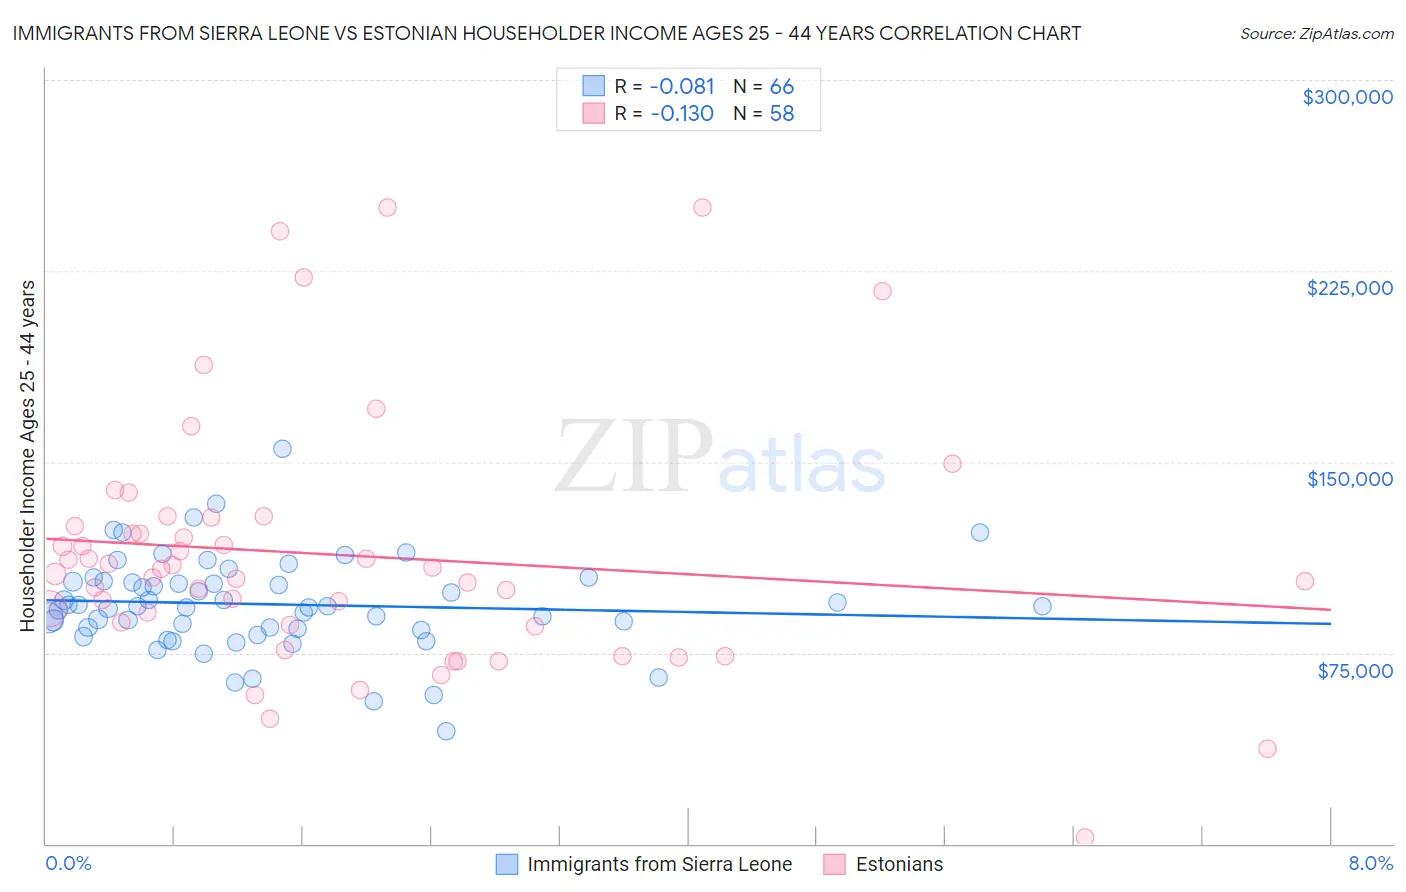
Immigrants from Sierra Leone vs Estonian Householder Income Ages 25 - 44 years Correlation Chart
The statistical analysis conducted on geographies consisting of 101,610,295 people shows a slight negative correlation between the proportion of Immigrants from Sierra Leone and household income with householder between the ages 25 and 44 in the United States with a correlation coefficient (R) of -0.081 and weighted average of $93,115. Similarly, the statistical analysis conducted on geographies consisting of 123,375,141 people shows a poor negative correlation between the proportion of Estonians and household income with householder between the ages 25 and 44 in the United States with a correlation coefficient (R) of -0.130 and weighted average of $107,269, a difference of 15.2%.
Householder Income Ages 25 - 44 years Correlation Summary
| Measurement | Immigrants from Sierra Leone | Estonian |
| Minimum | $44,243 | $2,499 |
| Maximum | $155,156 | $250,001 |
| Range | $110,913 | $247,502 |
| Mean | $94,051 | $113,361 |
| Median | $93,126 | $106,893 |
| Interquartile 25% (IQ1) | $84,614 | $85,980 |
| Interquartile 75% (IQ3) | $102,869 | $124,694 |
| Interquartile Range (IQR) | $18,254 | $38,714 |
| Standard Deviation (Sample) | $18,629 | $49,215 |
| Standard Deviation (Population) | $18,487 | $48,789 |
Similar Demographics by Householder Income Ages 25 - 44 years
Demographics Similar to Immigrants from Sierra Leone by Householder Income Ages 25 - 44 years
In terms of householder income ages 25 - 44 years, the demographic groups most similar to Immigrants from Sierra Leone are Dutch ($93,081, a difference of 0.040%), Welsh ($93,039, a difference of 0.080%), Tlingit-Haida ($92,987, a difference of 0.14%), Immigrants from Costa Rica ($92,876, a difference of 0.26%), and Spaniard ($93,366, a difference of 0.27%).
| Demographics | Rating | Rank | Householder Income Ages 25 - 44 years |
| Puget Sound Salish | 37.7 /100 | #181 | Fair $93,661 |
| Uruguayans | 37.3 /100 | #182 | Fair $93,631 |
| Guamanians/Chamorros | 36.5 /100 | #183 | Fair $93,569 |
| Germans | 36.0 /100 | #184 | Fair $93,531 |
| Immigrants | Eritrea | 35.2 /100 | #185 | Fair $93,466 |
| Sierra Leoneans | 34.8 /100 | #186 | Fair $93,435 |
| Spaniards | 34.0 /100 | #187 | Fair $93,366 |
| Immigrants | Sierra Leone | 30.9 /100 | #188 | Fair $93,115 |
| Dutch | 30.5 /100 | #189 | Fair $93,081 |
| Welsh | 30.0 /100 | #190 | Fair $93,039 |
| Tlingit-Haida | 29.4 /100 | #191 | Fair $92,987 |
| Immigrants | Costa Rica | 28.2 /100 | #192 | Fair $92,876 |
| Samoans | 23.0 /100 | #193 | Fair $92,385 |
| Immigrants | Azores | 22.4 /100 | #194 | Fair $92,322 |
| Celtics | 21.6 /100 | #195 | Fair $92,241 |
Demographics Similar to Estonians by Householder Income Ages 25 - 44 years
In terms of householder income ages 25 - 44 years, the demographic groups most similar to Estonians are Bulgarian ($107,264, a difference of 0.010%), Immigrants from Turkey ($107,258, a difference of 0.010%), Cambodian ($107,148, a difference of 0.11%), Immigrants from Belarus ($107,393, a difference of 0.12%), and Israeli ($107,579, a difference of 0.29%).
| Demographics | Rating | Rank | Householder Income Ages 25 - 44 years |
| Immigrants | Lithuania | 99.9 /100 | #40 | Exceptional $108,149 |
| Immigrants | Bolivia | 99.9 /100 | #41 | Exceptional $108,128 |
| Australians | 99.9 /100 | #42 | Exceptional $107,912 |
| Immigrants | Malaysia | 99.9 /100 | #43 | Exceptional $107,650 |
| Immigrants | Indonesia | 99.9 /100 | #44 | Exceptional $107,627 |
| Israelis | 99.9 /100 | #45 | Exceptional $107,579 |
| Immigrants | Belarus | 99.9 /100 | #46 | Exceptional $107,393 |
| Estonians | 99.9 /100 | #47 | Exceptional $107,269 |
| Bulgarians | 99.9 /100 | #48 | Exceptional $107,264 |
| Immigrants | Turkey | 99.9 /100 | #49 | Exceptional $107,258 |
| Cambodians | 99.9 /100 | #50 | Exceptional $107,148 |
| Immigrants | Czechoslovakia | 99.9 /100 | #51 | Exceptional $106,888 |
| Immigrants | Europe | 99.9 /100 | #52 | Exceptional $106,817 |
| Immigrants | Norway | 99.9 /100 | #53 | Exceptional $106,629 |
| Paraguayans | 99.9 /100 | #54 | Exceptional $106,615 |