Immigrants from Sierra Leone vs Immigrants from Uzbekistan Householder Income Ages 25 - 44 years
COMPARE
Immigrants from Sierra Leone
Immigrants from Uzbekistan
Householder Income Ages 25 - 44 years
Householder Income Ages 25 - 44 years Comparison
Immigrants from Sierra Leone
Immigrants from Uzbekistan
$93,115
HOUSEHOLDER INCOME AGES 25 - 44 YEARS
30.9/ 100
METRIC RATING
188th/ 347
METRIC RANK
$98,849
HOUSEHOLDER INCOME AGES 25 - 44 YEARS
91.5/ 100
METRIC RATING
122nd/ 347
METRIC RANK
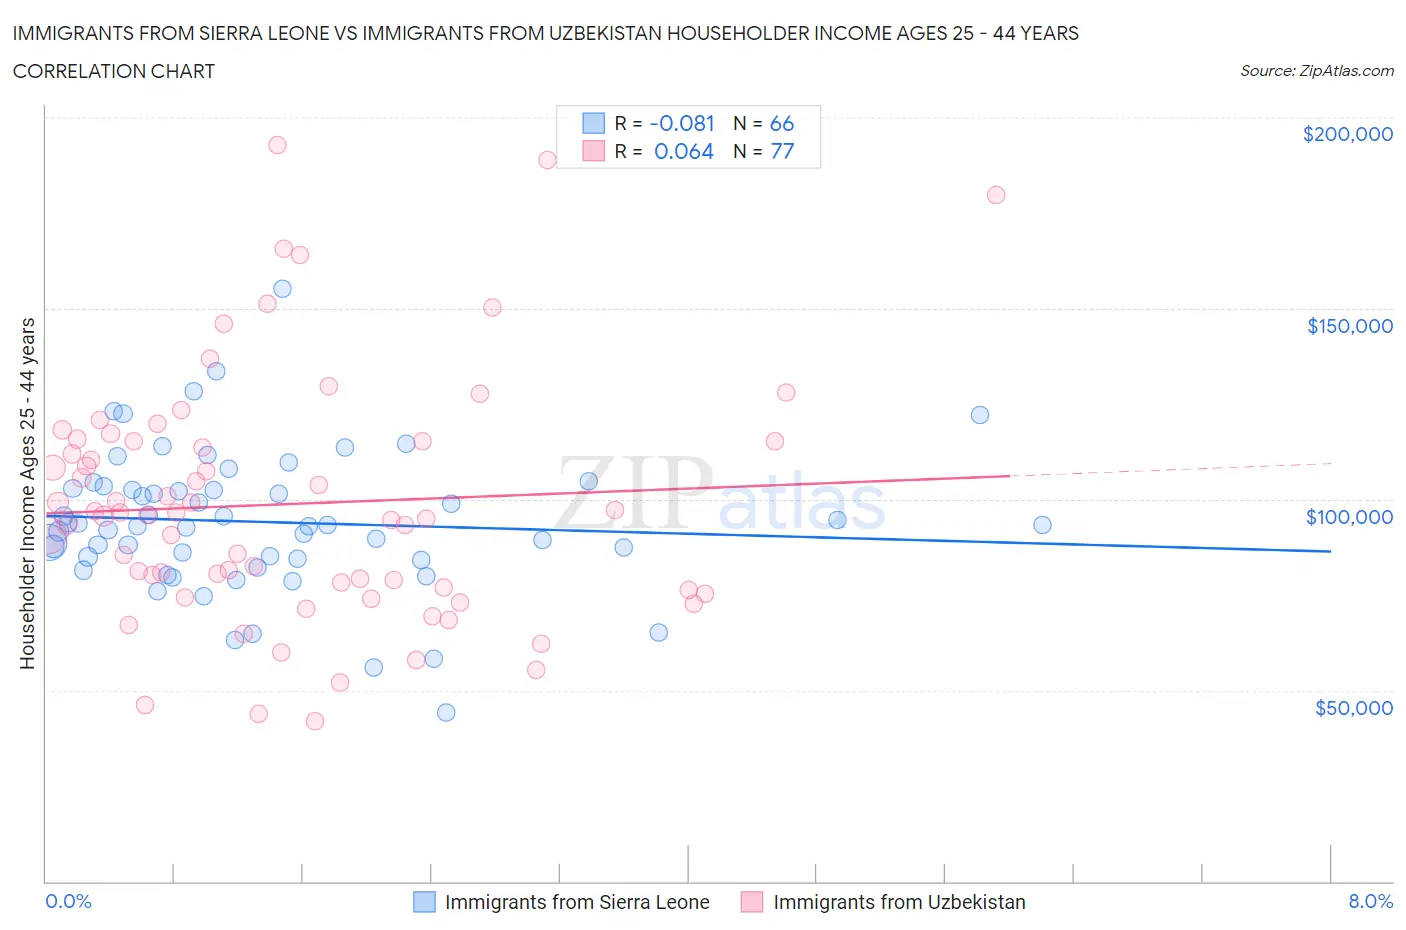
Immigrants from Sierra Leone vs Immigrants from Uzbekistan Householder Income Ages 25 - 44 years Correlation Chart
The statistical analysis conducted on geographies consisting of 101,610,295 people shows a slight negative correlation between the proportion of Immigrants from Sierra Leone and household income with householder between the ages 25 and 44 in the United States with a correlation coefficient (R) of -0.081 and weighted average of $93,115. Similarly, the statistical analysis conducted on geographies consisting of 118,660,152 people shows a slight positive correlation between the proportion of Immigrants from Uzbekistan and household income with householder between the ages 25 and 44 in the United States with a correlation coefficient (R) of 0.064 and weighted average of $98,849, a difference of 6.2%.
Householder Income Ages 25 - 44 years Correlation Summary
| Measurement | Immigrants from Sierra Leone | Immigrants from Uzbekistan |
| Minimum | $44,243 | $41,890 |
| Maximum | $155,156 | $192,849 |
| Range | $110,913 | $150,959 |
| Mean | $94,051 | $98,791 |
| Median | $93,126 | $95,849 |
| Interquartile 25% (IQ1) | $84,614 | $76,528 |
| Interquartile 75% (IQ3) | $102,869 | $115,337 |
| Interquartile Range (IQR) | $18,254 | $38,808 |
| Standard Deviation (Sample) | $18,629 | $32,098 |
| Standard Deviation (Population) | $18,487 | $31,889 |
Similar Demographics by Householder Income Ages 25 - 44 years
Demographics Similar to Immigrants from Sierra Leone by Householder Income Ages 25 - 44 years
In terms of householder income ages 25 - 44 years, the demographic groups most similar to Immigrants from Sierra Leone are Dutch ($93,081, a difference of 0.040%), Welsh ($93,039, a difference of 0.080%), Tlingit-Haida ($92,987, a difference of 0.14%), Immigrants from Costa Rica ($92,876, a difference of 0.26%), and Spaniard ($93,366, a difference of 0.27%).
| Demographics | Rating | Rank | Householder Income Ages 25 - 44 years |
| Puget Sound Salish | 37.7 /100 | #181 | Fair $93,661 |
| Uruguayans | 37.3 /100 | #182 | Fair $93,631 |
| Guamanians/Chamorros | 36.5 /100 | #183 | Fair $93,569 |
| Germans | 36.0 /100 | #184 | Fair $93,531 |
| Immigrants | Eritrea | 35.2 /100 | #185 | Fair $93,466 |
| Sierra Leoneans | 34.8 /100 | #186 | Fair $93,435 |
| Spaniards | 34.0 /100 | #187 | Fair $93,366 |
| Immigrants | Sierra Leone | 30.9 /100 | #188 | Fair $93,115 |
| Dutch | 30.5 /100 | #189 | Fair $93,081 |
| Welsh | 30.0 /100 | #190 | Fair $93,039 |
| Tlingit-Haida | 29.4 /100 | #191 | Fair $92,987 |
| Immigrants | Costa Rica | 28.2 /100 | #192 | Fair $92,876 |
| Samoans | 23.0 /100 | #193 | Fair $92,385 |
| Immigrants | Azores | 22.4 /100 | #194 | Fair $92,322 |
| Celtics | 21.6 /100 | #195 | Fair $92,241 |
Demographics Similar to Immigrants from Uzbekistan by Householder Income Ages 25 - 44 years
In terms of householder income ages 25 - 44 years, the demographic groups most similar to Immigrants from Uzbekistan are Peruvian ($98,886, a difference of 0.040%), Palestinian ($98,777, a difference of 0.070%), Zimbabwean ($98,586, a difference of 0.27%), Swedish ($99,136, a difference of 0.29%), and Jordanian ($99,186, a difference of 0.34%).
| Demographics | Rating | Rank | Householder Income Ages 25 - 44 years |
| Carpatho Rusyns | 93.7 /100 | #115 | Exceptional $99,449 |
| Portuguese | 93.7 /100 | #116 | Exceptional $99,429 |
| Immigrants | Northern Africa | 93.0 /100 | #117 | Exceptional $99,232 |
| Syrians | 92.9 /100 | #118 | Exceptional $99,215 |
| Jordanians | 92.8 /100 | #119 | Exceptional $99,186 |
| Swedes | 92.7 /100 | #120 | Exceptional $99,136 |
| Peruvians | 91.7 /100 | #121 | Exceptional $98,886 |
| Immigrants | Uzbekistan | 91.5 /100 | #122 | Exceptional $98,849 |
| Palestinians | 91.2 /100 | #123 | Exceptional $98,777 |
| Zimbabweans | 90.3 /100 | #124 | Exceptional $98,586 |
| Pakistanis | 89.3 /100 | #125 | Excellent $98,401 |
| British | 89.1 /100 | #126 | Excellent $98,359 |
| Serbians | 88.9 /100 | #127 | Excellent $98,320 |
| Europeans | 88.9 /100 | #128 | Excellent $98,310 |
| Brazilians | 88.6 /100 | #129 | Excellent $98,267 |