Immigrants from Sierra Leone vs Spanish American Indian Householder Income Ages 25 - 44 years
COMPARE
Immigrants from Sierra Leone
Spanish American Indian
Householder Income Ages 25 - 44 years
Householder Income Ages 25 - 44 years Comparison
Immigrants from Sierra Leone
Spanish American Indians
$93,115
HOUSEHOLDER INCOME AGES 25 - 44 YEARS
30.9/ 100
METRIC RATING
188th/ 347
METRIC RANK
$84,085
HOUSEHOLDER INCOME AGES 25 - 44 YEARS
0.3/ 100
METRIC RATING
269th/ 347
METRIC RANK
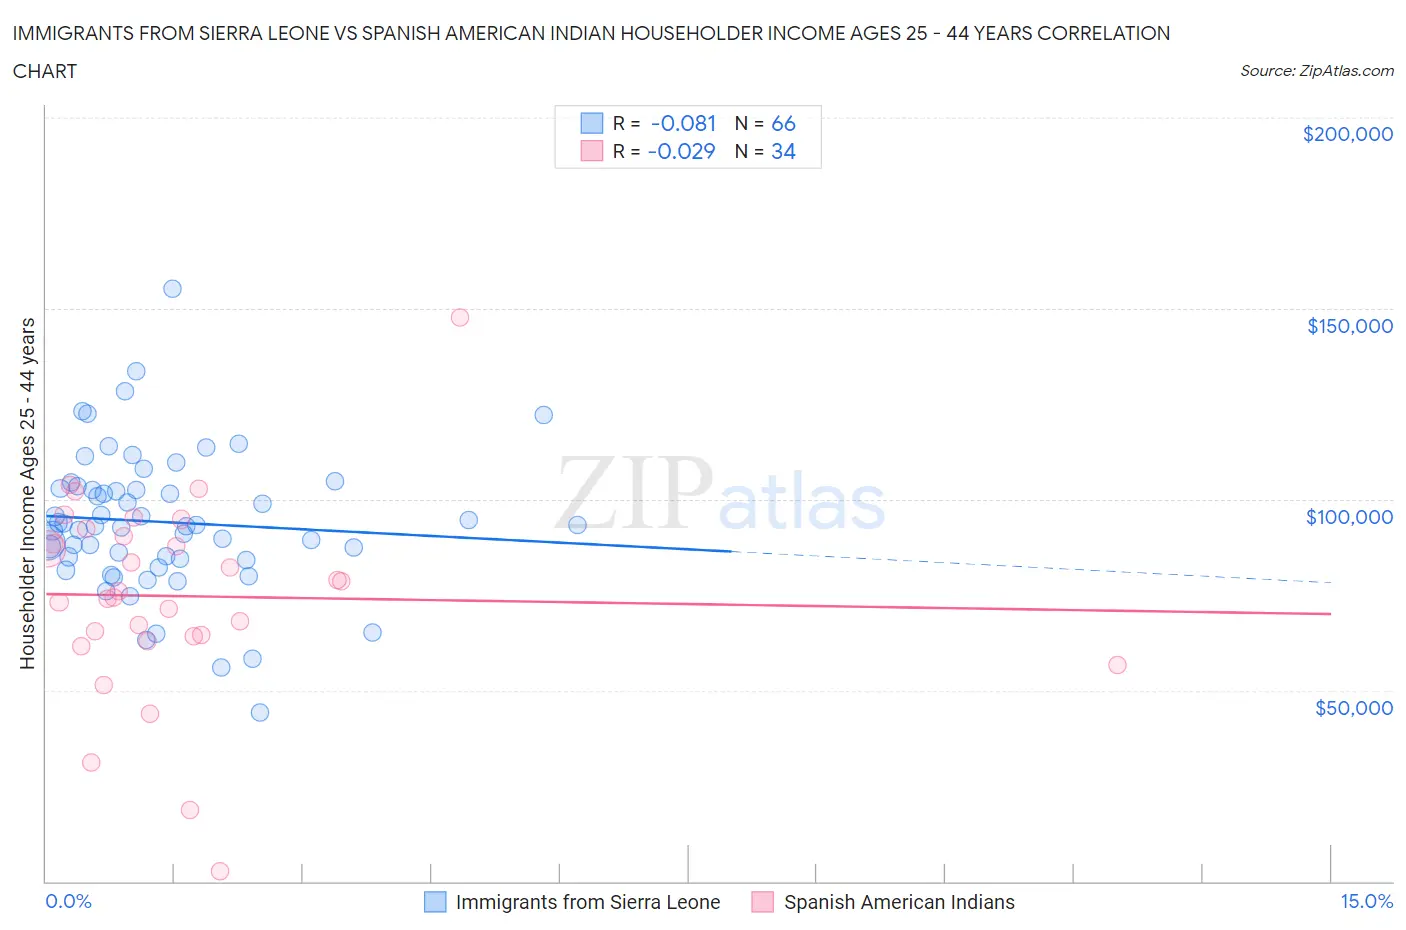
Immigrants from Sierra Leone vs Spanish American Indian Householder Income Ages 25 - 44 years Correlation Chart
The statistical analysis conducted on geographies consisting of 101,610,295 people shows a slight negative correlation between the proportion of Immigrants from Sierra Leone and household income with householder between the ages 25 and 44 in the United States with a correlation coefficient (R) of -0.081 and weighted average of $93,115. Similarly, the statistical analysis conducted on geographies consisting of 73,137,186 people shows no correlation between the proportion of Spanish American Indians and household income with householder between the ages 25 and 44 in the United States with a correlation coefficient (R) of -0.029 and weighted average of $84,085, a difference of 10.7%.
Householder Income Ages 25 - 44 years Correlation Summary
| Measurement | Immigrants from Sierra Leone | Spanish American Indian |
| Minimum | $44,243 | $2,499 |
| Maximum | $155,156 | $147,500 |
| Range | $110,913 | $145,001 |
| Mean | $94,051 | $74,648 |
| Median | $93,126 | $75,146 |
| Interquartile 25% (IQ1) | $84,614 | $64,148 |
| Interquartile 75% (IQ3) | $102,869 | $90,277 |
| Interquartile Range (IQR) | $18,254 | $26,129 |
| Standard Deviation (Sample) | $18,629 | $26,399 |
| Standard Deviation (Population) | $18,487 | $26,008 |
Similar Demographics by Householder Income Ages 25 - 44 years
Demographics Similar to Immigrants from Sierra Leone by Householder Income Ages 25 - 44 years
In terms of householder income ages 25 - 44 years, the demographic groups most similar to Immigrants from Sierra Leone are Dutch ($93,081, a difference of 0.040%), Welsh ($93,039, a difference of 0.080%), Tlingit-Haida ($92,987, a difference of 0.14%), Immigrants from Costa Rica ($92,876, a difference of 0.26%), and Spaniard ($93,366, a difference of 0.27%).
| Demographics | Rating | Rank | Householder Income Ages 25 - 44 years |
| Puget Sound Salish | 37.7 /100 | #181 | Fair $93,661 |
| Uruguayans | 37.3 /100 | #182 | Fair $93,631 |
| Guamanians/Chamorros | 36.5 /100 | #183 | Fair $93,569 |
| Germans | 36.0 /100 | #184 | Fair $93,531 |
| Immigrants | Eritrea | 35.2 /100 | #185 | Fair $93,466 |
| Sierra Leoneans | 34.8 /100 | #186 | Fair $93,435 |
| Spaniards | 34.0 /100 | #187 | Fair $93,366 |
| Immigrants | Sierra Leone | 30.9 /100 | #188 | Fair $93,115 |
| Dutch | 30.5 /100 | #189 | Fair $93,081 |
| Welsh | 30.0 /100 | #190 | Fair $93,039 |
| Tlingit-Haida | 29.4 /100 | #191 | Fair $92,987 |
| Immigrants | Costa Rica | 28.2 /100 | #192 | Fair $92,876 |
| Samoans | 23.0 /100 | #193 | Fair $92,385 |
| Immigrants | Azores | 22.4 /100 | #194 | Fair $92,322 |
| Celtics | 21.6 /100 | #195 | Fair $92,241 |
Demographics Similar to Spanish American Indians by Householder Income Ages 25 - 44 years
In terms of householder income ages 25 - 44 years, the demographic groups most similar to Spanish American Indians are Subsaharan African ($84,235, a difference of 0.18%), Jamaican ($83,933, a difference of 0.18%), Hmong ($84,258, a difference of 0.21%), Immigrants from Cabo Verde ($84,304, a difference of 0.26%), and Sudanese ($84,401, a difference of 0.38%).
| Demographics | Rating | Rank | Householder Income Ages 25 - 44 years |
| Cree | 0.4 /100 | #262 | Tragic $84,574 |
| Belizeans | 0.4 /100 | #263 | Tragic $84,534 |
| Osage | 0.4 /100 | #264 | Tragic $84,461 |
| Sudanese | 0.4 /100 | #265 | Tragic $84,401 |
| Immigrants | Cabo Verde | 0.3 /100 | #266 | Tragic $84,304 |
| Hmong | 0.3 /100 | #267 | Tragic $84,258 |
| Sub-Saharan Africans | 0.3 /100 | #268 | Tragic $84,235 |
| Spanish American Indians | 0.3 /100 | #269 | Tragic $84,085 |
| Jamaicans | 0.3 /100 | #270 | Tragic $83,933 |
| Somalis | 0.2 /100 | #271 | Tragic $83,752 |
| Spanish Americans | 0.2 /100 | #272 | Tragic $83,722 |
| Iroquois | 0.2 /100 | #273 | Tragic $83,682 |
| Marshallese | 0.2 /100 | #274 | Tragic $83,575 |
| Immigrants | Jamaica | 0.2 /100 | #275 | Tragic $83,298 |
| Immigrants | Belize | 0.2 /100 | #276 | Tragic $83,141 |