Immigrants from Scotland vs Nepalese Median Earnings
COMPARE
Immigrants from Scotland
Nepalese
Median Earnings
Median Earnings Comparison
Immigrants from Scotland
Nepalese
$50,741
MEDIAN EARNINGS
99.8/ 100
METRIC RATING
75th/ 347
METRIC RANK
$43,860
MEDIAN EARNINGS
2.6/ 100
METRIC RATING
248th/ 347
METRIC RANK
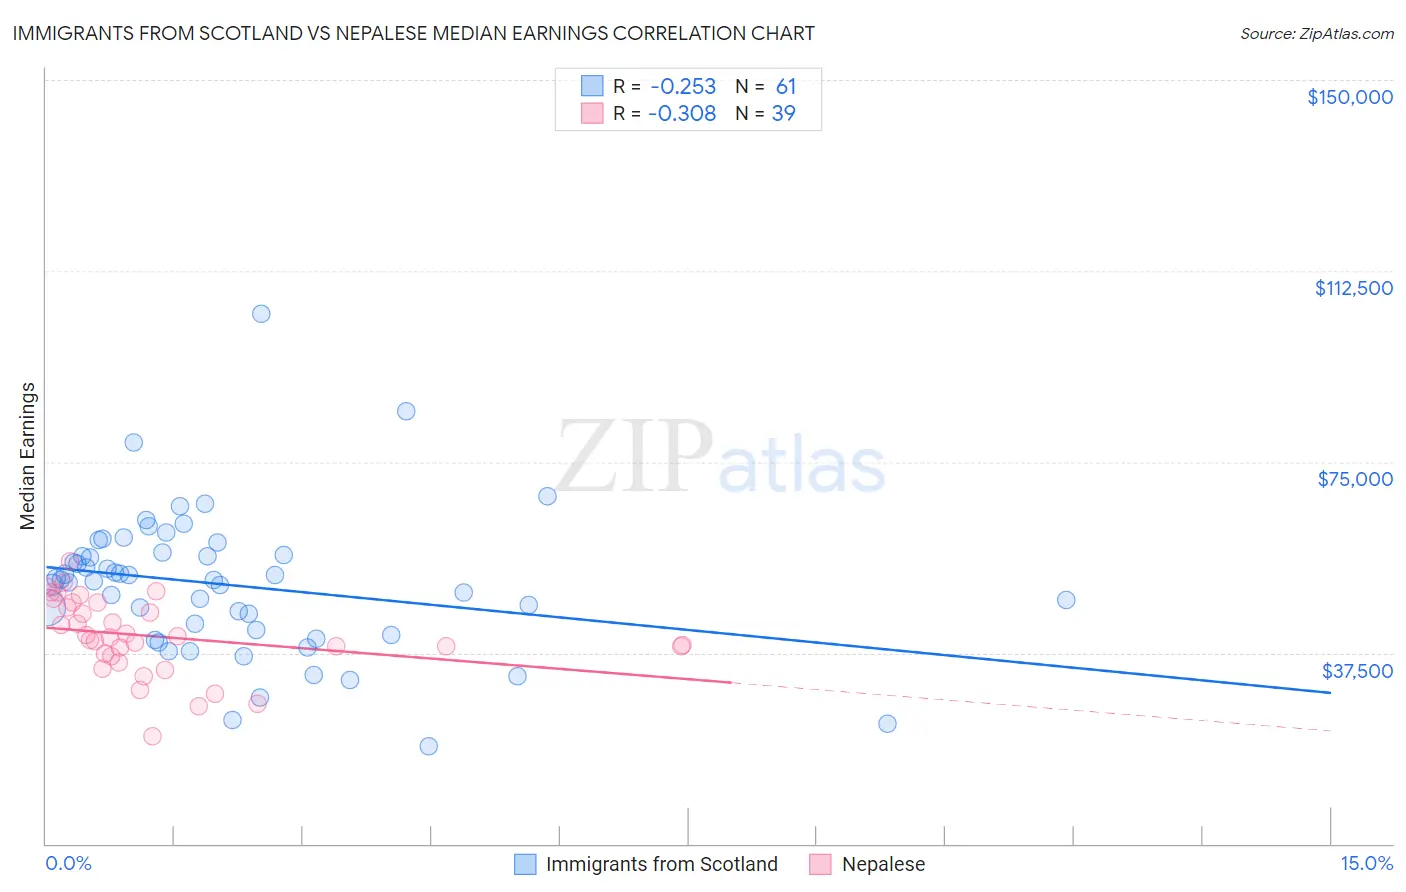
Immigrants from Scotland vs Nepalese Median Earnings Correlation Chart
The statistical analysis conducted on geographies consisting of 196,389,390 people shows a weak negative correlation between the proportion of Immigrants from Scotland and median earnings in the United States with a correlation coefficient (R) of -0.253 and weighted average of $50,741. Similarly, the statistical analysis conducted on geographies consisting of 24,434,314 people shows a mild negative correlation between the proportion of Nepalese and median earnings in the United States with a correlation coefficient (R) of -0.308 and weighted average of $43,860, a difference of 15.7%.
Median Earnings Correlation Summary
| Measurement | Immigrants from Scotland | Nepalese |
| Minimum | $19,118 | $21,187 |
| Maximum | $104,015 | $55,594 |
| Range | $84,897 | $34,407 |
| Mean | $50,819 | $40,712 |
| Median | $51,683 | $40,613 |
| Interquartile 25% (IQ1) | $41,420 | $36,926 |
| Interquartile 75% (IQ3) | $56,954 | $47,393 |
| Interquartile Range (IQR) | $15,534 | $10,467 |
| Standard Deviation (Sample) | $14,157 | $7,531 |
| Standard Deviation (Population) | $14,040 | $7,434 |
Similar Demographics by Median Earnings
Demographics Similar to Immigrants from Scotland by Median Earnings
In terms of median earnings, the demographic groups most similar to Immigrants from Scotland are South African ($50,752, a difference of 0.020%), Immigrants from Netherlands ($50,818, a difference of 0.15%), Immigrants from Egypt ($50,901, a difference of 0.32%), Immigrants from Italy ($50,581, a difference of 0.32%), and Immigrants from Western Europe ($50,549, a difference of 0.38%).
| Demographics | Rating | Rank | Median Earnings |
| Paraguayans | 99.9 /100 | #68 | Exceptional $51,068 |
| Mongolians | 99.8 /100 | #69 | Exceptional $51,038 |
| Lithuanians | 99.8 /100 | #70 | Exceptional $50,991 |
| Immigrants | Ukraine | 99.8 /100 | #71 | Exceptional $50,984 |
| Immigrants | Egypt | 99.8 /100 | #72 | Exceptional $50,901 |
| Immigrants | Netherlands | 99.8 /100 | #73 | Exceptional $50,818 |
| South Africans | 99.8 /100 | #74 | Exceptional $50,752 |
| Immigrants | Scotland | 99.8 /100 | #75 | Exceptional $50,741 |
| Immigrants | Italy | 99.7 /100 | #76 | Exceptional $50,581 |
| Immigrants | Western Europe | 99.7 /100 | #77 | Exceptional $50,549 |
| Argentineans | 99.6 /100 | #78 | Exceptional $50,399 |
| Laotians | 99.6 /100 | #79 | Exceptional $50,343 |
| Ukrainians | 99.6 /100 | #80 | Exceptional $50,320 |
| Immigrants | Southern Europe | 99.6 /100 | #81 | Exceptional $50,280 |
| Immigrants | Moldova | 99.5 /100 | #82 | Exceptional $50,274 |
Demographics Similar to Nepalese by Median Earnings
In terms of median earnings, the demographic groups most similar to Nepalese are Malaysian ($43,844, a difference of 0.040%), Immigrants from Cabo Verde ($43,963, a difference of 0.24%), Alaska Native ($43,750, a difference of 0.25%), Immigrants from West Indies ($43,989, a difference of 0.29%), and Immigrants from Burma/Myanmar ($43,998, a difference of 0.31%).
| Demographics | Rating | Rank | Median Earnings |
| Samoans | 4.2 /100 | #241 | Tragic $44,206 |
| Immigrants | Venezuela | 4.0 /100 | #242 | Tragic $44,163 |
| Sub-Saharan Africans | 3.7 /100 | #243 | Tragic $44,118 |
| Immigrants | Nonimmigrants | 3.7 /100 | #244 | Tragic $44,117 |
| Immigrants | Burma/Myanmar | 3.2 /100 | #245 | Tragic $43,998 |
| Immigrants | West Indies | 3.1 /100 | #246 | Tragic $43,989 |
| Immigrants | Cabo Verde | 3.0 /100 | #247 | Tragic $43,963 |
| Nepalese | 2.6 /100 | #248 | Tragic $43,860 |
| Malaysians | 2.6 /100 | #249 | Tragic $43,844 |
| Alaska Natives | 2.3 /100 | #250 | Tragic $43,750 |
| Tsimshian | 2.1 /100 | #251 | Tragic $43,695 |
| Hawaiians | 2.0 /100 | #252 | Tragic $43,673 |
| Somalis | 1.8 /100 | #253 | Tragic $43,567 |
| Liberians | 1.7 /100 | #254 | Tragic $43,536 |
| Immigrants | Middle Africa | 1.4 /100 | #255 | Tragic $43,416 |