Immigrants from Scotland vs Nepalese 7th Grade
COMPARE
Immigrants from Scotland
Nepalese
7th Grade
7th Grade Comparison
Immigrants from Scotland
Nepalese
97.1%
7TH GRADE
99.9/ 100
METRIC RATING
50th/ 347
METRIC RANK
93.2%
7TH GRADE
0.0/ 100
METRIC RATING
326th/ 347
METRIC RANK
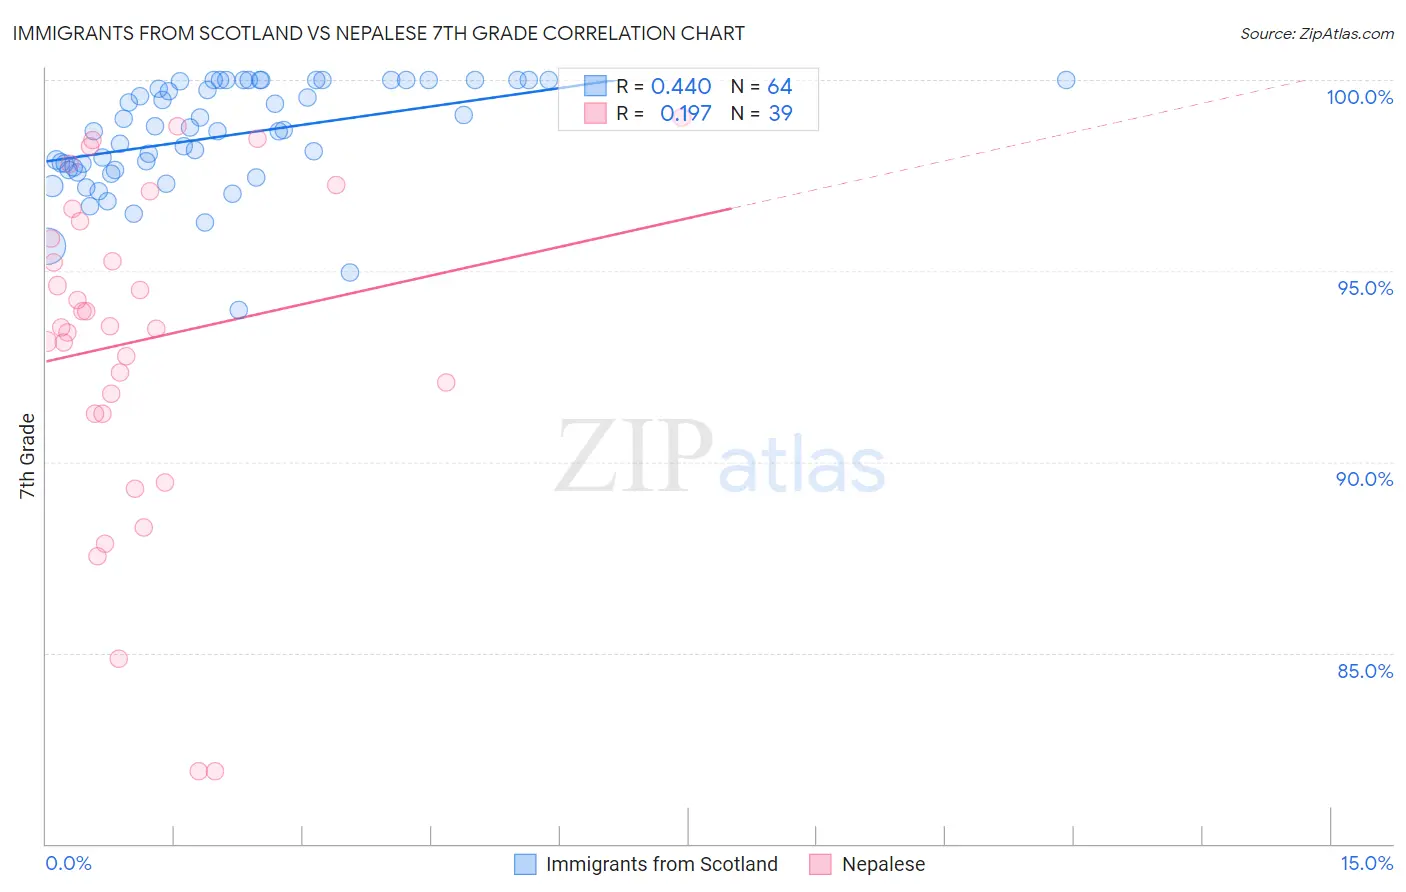
Immigrants from Scotland vs Nepalese 7th Grade Correlation Chart
The statistical analysis conducted on geographies consisting of 196,398,887 people shows a moderate positive correlation between the proportion of Immigrants from Scotland and percentage of population with at least 7th grade education in the United States with a correlation coefficient (R) of 0.440 and weighted average of 97.1%. Similarly, the statistical analysis conducted on geographies consisting of 24,519,269 people shows a poor positive correlation between the proportion of Nepalese and percentage of population with at least 7th grade education in the United States with a correlation coefficient (R) of 0.197 and weighted average of 93.2%, a difference of 4.2%.
7th Grade Correlation Summary
| Measurement | Immigrants from Scotland | Nepalese |
| Minimum | 94.0% | 81.9% |
| Maximum | 100.0% | 99.0% |
| Range | 6.0% | 17.1% |
| Mean | 98.5% | 93.3% |
| Median | 98.7% | 93.6% |
| Interquartile 25% (IQ1) | 97.6% | 91.3% |
| Interquartile 75% (IQ3) | 100.0% | 96.6% |
| Interquartile Range (IQR) | 2.4% | 5.4% |
| Standard Deviation (Sample) | 1.4% | 4.4% |
| Standard Deviation (Population) | 1.4% | 4.3% |
Similar Demographics by 7th Grade
Demographics Similar to Immigrants from Scotland by 7th Grade
In terms of 7th grade, the demographic groups most similar to Immigrants from Scotland are Slavic (97.1%, a difference of 0.0%), Celtic (97.1%, a difference of 0.010%), Bulgarian (97.1%, a difference of 0.020%), Estonian (97.0%, a difference of 0.030%), and Czechoslovakian (97.1%, a difference of 0.040%).
| Demographics | Rating | Rank | 7th Grade |
| Maltese | 99.9 /100 | #43 | Exceptional 97.1% |
| Northern Europeans | 99.9 /100 | #44 | Exceptional 97.1% |
| Czechoslovakians | 99.9 /100 | #45 | Exceptional 97.1% |
| Aleuts | 99.9 /100 | #46 | Exceptional 97.1% |
| Bulgarians | 99.9 /100 | #47 | Exceptional 97.1% |
| Celtics | 99.9 /100 | #48 | Exceptional 97.1% |
| Slavs | 99.9 /100 | #49 | Exceptional 97.1% |
| Immigrants | Scotland | 99.9 /100 | #50 | Exceptional 97.1% |
| Estonians | 99.9 /100 | #51 | Exceptional 97.0% |
| Greeks | 99.9 /100 | #52 | Exceptional 97.0% |
| Austrians | 99.8 /100 | #53 | Exceptional 97.0% |
| Australians | 99.8 /100 | #54 | Exceptional 97.0% |
| Russians | 99.8 /100 | #55 | Exceptional 97.0% |
| Serbians | 99.8 /100 | #56 | Exceptional 97.0% |
| Americans | 99.8 /100 | #57 | Exceptional 97.0% |
Demographics Similar to Nepalese by 7th Grade
In terms of 7th grade, the demographic groups most similar to Nepalese are Immigrants from Cabo Verde (93.1%, a difference of 0.070%), Central American Indian (93.3%, a difference of 0.11%), Dominican (93.3%, a difference of 0.18%), Immigrants from Belize (93.4%, a difference of 0.19%), and Immigrants from Nicaragua (93.0%, a difference of 0.20%).
| Demographics | Rating | Rank | 7th Grade |
| Immigrants | Cambodia | 0.0 /100 | #319 | Tragic 93.7% |
| Immigrants | Fiji | 0.0 /100 | #320 | Tragic 93.5% |
| Belizeans | 0.0 /100 | #321 | Tragic 93.5% |
| Nicaraguans | 0.0 /100 | #322 | Tragic 93.5% |
| Immigrants | Belize | 0.0 /100 | #323 | Tragic 93.4% |
| Dominicans | 0.0 /100 | #324 | Tragic 93.3% |
| Central American Indians | 0.0 /100 | #325 | Tragic 93.3% |
| Nepalese | 0.0 /100 | #326 | Tragic 93.2% |
| Immigrants | Cabo Verde | 0.0 /100 | #327 | Tragic 93.1% |
| Immigrants | Nicaragua | 0.0 /100 | #328 | Tragic 93.0% |
| Immigrants | Azores | 0.0 /100 | #329 | Tragic 93.0% |
| Immigrants | Dominican Republic | 0.0 /100 | #330 | Tragic 92.9% |
| Hondurans | 0.0 /100 | #331 | Tragic 92.9% |
| Hispanics or Latinos | 0.0 /100 | #332 | Tragic 92.7% |
| Immigrants | Armenia | 0.0 /100 | #333 | Tragic 92.7% |