Puerto Rican vs Nepalese Median Earnings
COMPARE
Puerto Rican
Nepalese
Median Earnings
Median Earnings Comparison
Puerto Ricans
Nepalese
$35,560
MEDIAN EARNINGS
0.0/ 100
METRIC RATING
347th/ 347
METRIC RANK
$43,860
MEDIAN EARNINGS
2.6/ 100
METRIC RATING
248th/ 347
METRIC RANK
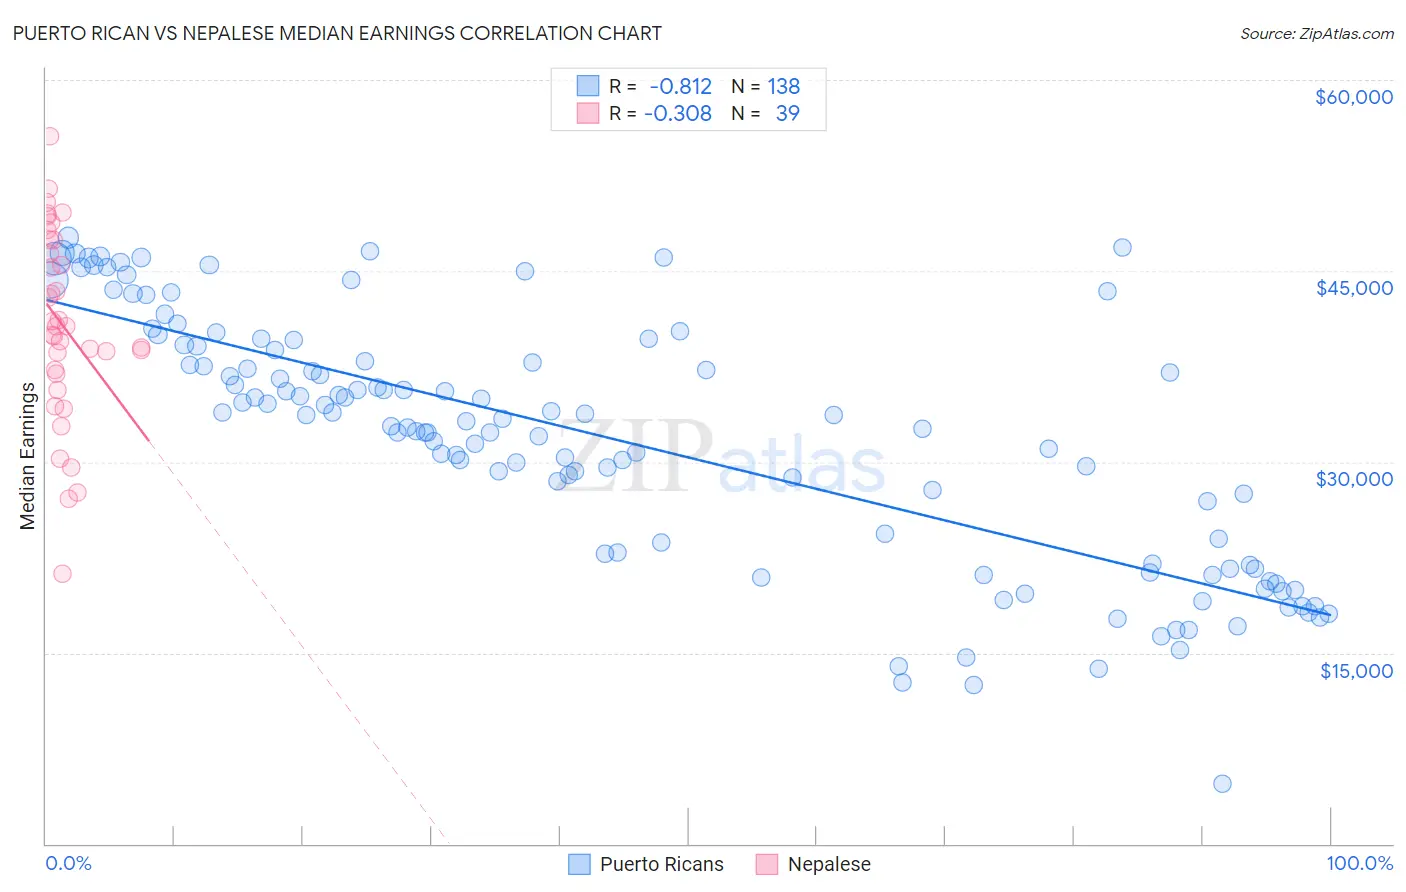
Puerto Rican vs Nepalese Median Earnings Correlation Chart
The statistical analysis conducted on geographies consisting of 528,218,544 people shows a very strong negative correlation between the proportion of Puerto Ricans and median earnings in the United States with a correlation coefficient (R) of -0.812 and weighted average of $35,560. Similarly, the statistical analysis conducted on geographies consisting of 24,434,314 people shows a mild negative correlation between the proportion of Nepalese and median earnings in the United States with a correlation coefficient (R) of -0.308 and weighted average of $43,860, a difference of 23.3%.
Median Earnings Correlation Summary
| Measurement | Puerto Rican | Nepalese |
| Minimum | $4,737 | $21,187 |
| Maximum | $47,601 | $55,594 |
| Range | $42,864 | $34,407 |
| Mean | $31,795 | $40,712 |
| Median | $33,297 | $40,613 |
| Interquartile 25% (IQ1) | $22,818 | $36,926 |
| Interquartile 75% (IQ3) | $39,100 | $47,393 |
| Interquartile Range (IQR) | $16,282 | $10,467 |
| Standard Deviation (Sample) | $9,771 | $7,531 |
| Standard Deviation (Population) | $9,736 | $7,434 |
Similar Demographics by Median Earnings
Demographics Similar to Puerto Ricans by Median Earnings
In terms of median earnings, the demographic groups most similar to Puerto Ricans are Yup'ik ($35,942, a difference of 1.1%), Tohono O'odham ($36,349, a difference of 2.2%), Arapaho ($36,586, a difference of 2.9%), Pueblo ($36,859, a difference of 3.6%), and Hopi ($36,871, a difference of 3.7%).
| Demographics | Rating | Rank | Median Earnings |
| Houma | 0.0 /100 | #333 | Tragic $38,949 |
| Spanish American Indians | 0.0 /100 | #334 | Tragic $38,907 |
| Natives/Alaskans | 0.0 /100 | #335 | Tragic $38,896 |
| Crow | 0.0 /100 | #336 | Tragic $38,707 |
| Immigrants | Cuba | 0.0 /100 | #337 | Tragic $38,426 |
| Pima | 0.0 /100 | #338 | Tragic $38,285 |
| Menominee | 0.0 /100 | #339 | Tragic $37,884 |
| Navajo | 0.0 /100 | #340 | Tragic $36,999 |
| Lumbee | 0.0 /100 | #341 | Tragic $36,876 |
| Hopi | 0.0 /100 | #342 | Tragic $36,871 |
| Pueblo | 0.0 /100 | #343 | Tragic $36,859 |
| Arapaho | 0.0 /100 | #344 | Tragic $36,586 |
| Tohono O'odham | 0.0 /100 | #345 | Tragic $36,349 |
| Yup'ik | 0.0 /100 | #346 | Tragic $35,942 |
| Puerto Ricans | 0.0 /100 | #347 | Tragic $35,560 |
Demographics Similar to Nepalese by Median Earnings
In terms of median earnings, the demographic groups most similar to Nepalese are Malaysian ($43,844, a difference of 0.040%), Immigrants from Cabo Verde ($43,963, a difference of 0.24%), Alaska Native ($43,750, a difference of 0.25%), Immigrants from West Indies ($43,989, a difference of 0.29%), and Immigrants from Burma/Myanmar ($43,998, a difference of 0.31%).
| Demographics | Rating | Rank | Median Earnings |
| Samoans | 4.2 /100 | #241 | Tragic $44,206 |
| Immigrants | Venezuela | 4.0 /100 | #242 | Tragic $44,163 |
| Sub-Saharan Africans | 3.7 /100 | #243 | Tragic $44,118 |
| Immigrants | Nonimmigrants | 3.7 /100 | #244 | Tragic $44,117 |
| Immigrants | Burma/Myanmar | 3.2 /100 | #245 | Tragic $43,998 |
| Immigrants | West Indies | 3.1 /100 | #246 | Tragic $43,989 |
| Immigrants | Cabo Verde | 3.0 /100 | #247 | Tragic $43,963 |
| Nepalese | 2.6 /100 | #248 | Tragic $43,860 |
| Malaysians | 2.6 /100 | #249 | Tragic $43,844 |
| Alaska Natives | 2.3 /100 | #250 | Tragic $43,750 |
| Tsimshian | 2.1 /100 | #251 | Tragic $43,695 |
| Hawaiians | 2.0 /100 | #252 | Tragic $43,673 |
| Somalis | 1.8 /100 | #253 | Tragic $43,567 |
| Liberians | 1.7 /100 | #254 | Tragic $43,536 |
| Immigrants | Middle Africa | 1.4 /100 | #255 | Tragic $43,416 |