Immigrants from Scotland vs Guamanian/Chamorro Median Earnings
COMPARE
Immigrants from Scotland
Guamanian/Chamorro
Median Earnings
Median Earnings Comparison
Immigrants from Scotland
Guamanians/Chamorros
$50,741
MEDIAN EARNINGS
99.8/ 100
METRIC RATING
75th/ 347
METRIC RANK
$45,933
MEDIAN EARNINGS
33.2/ 100
METRIC RATING
193rd/ 347
METRIC RANK
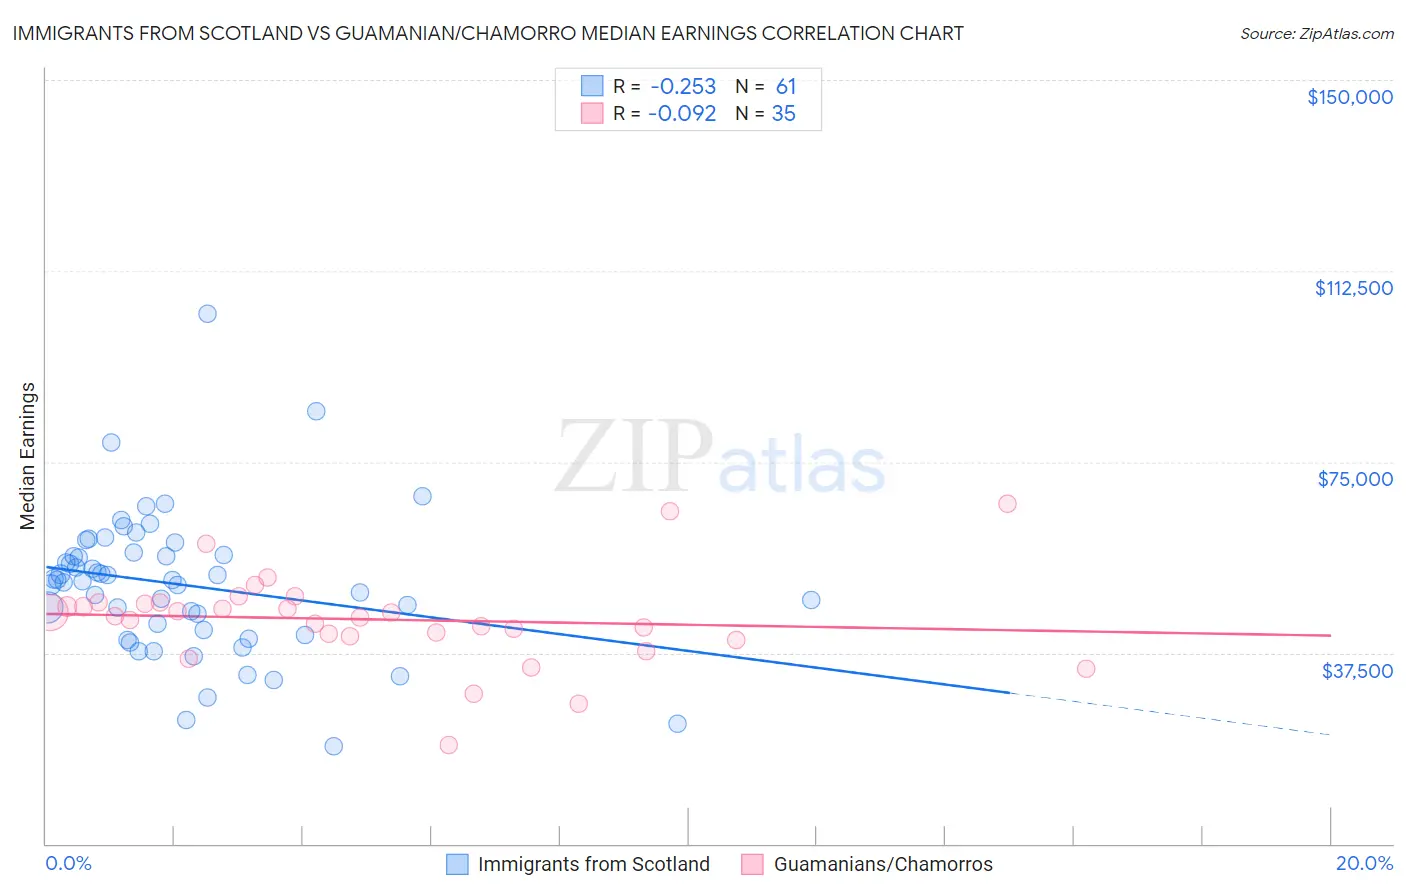
Immigrants from Scotland vs Guamanian/Chamorro Median Earnings Correlation Chart
The statistical analysis conducted on geographies consisting of 196,389,390 people shows a weak negative correlation between the proportion of Immigrants from Scotland and median earnings in the United States with a correlation coefficient (R) of -0.253 and weighted average of $50,741. Similarly, the statistical analysis conducted on geographies consisting of 221,957,733 people shows a slight negative correlation between the proportion of Guamanians/Chamorros and median earnings in the United States with a correlation coefficient (R) of -0.092 and weighted average of $45,933, a difference of 10.5%.
Median Earnings Correlation Summary
| Measurement | Immigrants from Scotland | Guamanian/Chamorro |
| Minimum | $19,118 | $19,375 |
| Maximum | $104,015 | $66,750 |
| Range | $84,897 | $47,375 |
| Mean | $50,819 | $44,054 |
| Median | $51,683 | $44,687 |
| Interquartile 25% (IQ1) | $41,420 | $40,774 |
| Interquartile 75% (IQ3) | $56,954 | $47,334 |
| Interquartile Range (IQR) | $15,534 | $6,560 |
| Standard Deviation (Sample) | $14,157 | $9,126 |
| Standard Deviation (Population) | $14,040 | $8,995 |
Similar Demographics by Median Earnings
Demographics Similar to Immigrants from Scotland by Median Earnings
In terms of median earnings, the demographic groups most similar to Immigrants from Scotland are South African ($50,752, a difference of 0.020%), Immigrants from Netherlands ($50,818, a difference of 0.15%), Immigrants from Egypt ($50,901, a difference of 0.32%), Immigrants from Italy ($50,581, a difference of 0.32%), and Immigrants from Western Europe ($50,549, a difference of 0.38%).
| Demographics | Rating | Rank | Median Earnings |
| Paraguayans | 99.9 /100 | #68 | Exceptional $51,068 |
| Mongolians | 99.8 /100 | #69 | Exceptional $51,038 |
| Lithuanians | 99.8 /100 | #70 | Exceptional $50,991 |
| Immigrants | Ukraine | 99.8 /100 | #71 | Exceptional $50,984 |
| Immigrants | Egypt | 99.8 /100 | #72 | Exceptional $50,901 |
| Immigrants | Netherlands | 99.8 /100 | #73 | Exceptional $50,818 |
| South Africans | 99.8 /100 | #74 | Exceptional $50,752 |
| Immigrants | Scotland | 99.8 /100 | #75 | Exceptional $50,741 |
| Immigrants | Italy | 99.7 /100 | #76 | Exceptional $50,581 |
| Immigrants | Western Europe | 99.7 /100 | #77 | Exceptional $50,549 |
| Argentineans | 99.6 /100 | #78 | Exceptional $50,399 |
| Laotians | 99.6 /100 | #79 | Exceptional $50,343 |
| Ukrainians | 99.6 /100 | #80 | Exceptional $50,320 |
| Immigrants | Southern Europe | 99.6 /100 | #81 | Exceptional $50,280 |
| Immigrants | Moldova | 99.5 /100 | #82 | Exceptional $50,274 |
Demographics Similar to Guamanians/Chamorros by Median Earnings
In terms of median earnings, the demographic groups most similar to Guamanians/Chamorros are German ($45,935, a difference of 0.0%), Finnish ($45,940, a difference of 0.010%), Immigrants from Costa Rica ($45,928, a difference of 0.010%), Immigrants from St. Vincent and the Grenadines ($45,908, a difference of 0.060%), and Yugoslavian ($45,846, a difference of 0.19%).
| Demographics | Rating | Rank | Median Earnings |
| Vietnamese | 40.9 /100 | #186 | Average $46,172 |
| Iraqis | 39.9 /100 | #187 | Fair $46,140 |
| Immigrants | Armenia | 38.3 /100 | #188 | Fair $46,094 |
| Spaniards | 37.2 /100 | #189 | Fair $46,059 |
| French Canadians | 36.1 /100 | #190 | Fair $46,026 |
| Finns | 33.4 /100 | #191 | Fair $45,940 |
| Germans | 33.2 /100 | #192 | Fair $45,935 |
| Guamanians/Chamorros | 33.2 /100 | #193 | Fair $45,933 |
| Immigrants | Costa Rica | 33.0 /100 | #194 | Fair $45,928 |
| Immigrants | St. Vincent and the Grenadines | 32.4 /100 | #195 | Fair $45,908 |
| Yugoslavians | 30.5 /100 | #196 | Fair $45,846 |
| Barbadians | 30.5 /100 | #197 | Fair $45,846 |
| Trinidadians and Tobagonians | 29.7 /100 | #198 | Fair $45,820 |
| Immigrants | Barbados | 29.6 /100 | #199 | Fair $45,816 |
| Immigrants | Azores | 29.5 /100 | #200 | Fair $45,812 |