Immigrants from Scotland vs Immigrants from Pakistan Median Earnings
COMPARE
Immigrants from Scotland
Immigrants from Pakistan
Median Earnings
Median Earnings Comparison
Immigrants from Scotland
Immigrants from Pakistan
$50,741
MEDIAN EARNINGS
99.8/ 100
METRIC RATING
75th/ 347
METRIC RANK
$51,693
MEDIAN EARNINGS
99.9/ 100
METRIC RATING
56th/ 347
METRIC RANK
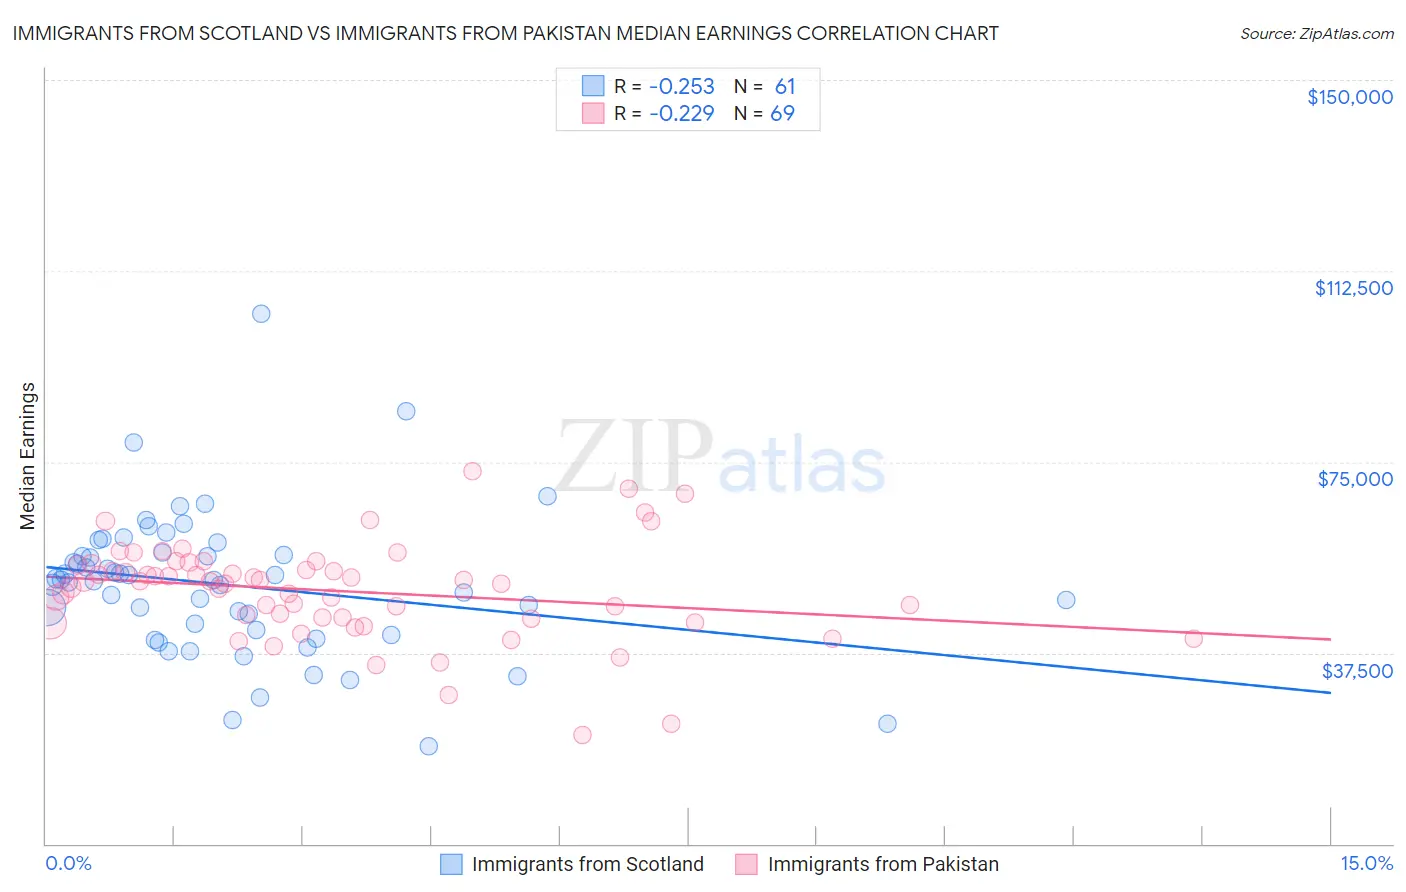
Immigrants from Scotland vs Immigrants from Pakistan Median Earnings Correlation Chart
The statistical analysis conducted on geographies consisting of 196,389,390 people shows a weak negative correlation between the proportion of Immigrants from Scotland and median earnings in the United States with a correlation coefficient (R) of -0.253 and weighted average of $50,741. Similarly, the statistical analysis conducted on geographies consisting of 283,895,517 people shows a weak negative correlation between the proportion of Immigrants from Pakistan and median earnings in the United States with a correlation coefficient (R) of -0.229 and weighted average of $51,693, a difference of 1.9%.
Median Earnings Correlation Summary
| Measurement | Immigrants from Scotland | Immigrants from Pakistan |
| Minimum | $19,118 | $21,371 |
| Maximum | $104,015 | $73,220 |
| Range | $84,897 | $51,849 |
| Mean | $50,819 | $49,677 |
| Median | $51,683 | $51,477 |
| Interquartile 25% (IQ1) | $41,420 | $44,262 |
| Interquartile 75% (IQ3) | $56,954 | $54,915 |
| Interquartile Range (IQR) | $15,534 | $10,654 |
| Standard Deviation (Sample) | $14,157 | $9,518 |
| Standard Deviation (Population) | $14,040 | $9,449 |
Demographics Similar to Immigrants from Scotland and Immigrants from Pakistan by Median Earnings
In terms of median earnings, the demographic groups most similar to Immigrants from Scotland are South African ($50,752, a difference of 0.020%), Immigrants from Netherlands ($50,818, a difference of 0.15%), Immigrants from Egypt ($50,901, a difference of 0.32%), Immigrants from Ukraine ($50,984, a difference of 0.48%), and Lithuanian ($50,991, a difference of 0.49%). Similarly, the demographic groups most similar to Immigrants from Pakistan are Egyptian ($51,701, a difference of 0.010%), Immigrants from Eastern Europe ($51,624, a difference of 0.13%), Immigrants from Bolivia ($51,605, a difference of 0.17%), Immigrants from Croatia ($51,581, a difference of 0.22%), and Immigrants from Serbia ($51,557, a difference of 0.26%).
| Demographics | Rating | Rank | Median Earnings |
| Egyptians | 99.9 /100 | #55 | Exceptional $51,701 |
| Immigrants | Pakistan | 99.9 /100 | #56 | Exceptional $51,693 |
| Immigrants | Eastern Europe | 99.9 /100 | #57 | Exceptional $51,624 |
| Immigrants | Bolivia | 99.9 /100 | #58 | Exceptional $51,605 |
| Immigrants | Croatia | 99.9 /100 | #59 | Exceptional $51,581 |
| Immigrants | Serbia | 99.9 /100 | #60 | Exceptional $51,557 |
| Immigrants | Latvia | 99.9 /100 | #61 | Exceptional $51,555 |
| Immigrants | Romania | 99.9 /100 | #62 | Exceptional $51,337 |
| Immigrants | Bulgaria | 99.9 /100 | #63 | Exceptional $51,318 |
| New Zealanders | 99.9 /100 | #64 | Exceptional $51,246 |
| Greeks | 99.9 /100 | #65 | Exceptional $51,164 |
| Afghans | 99.9 /100 | #66 | Exceptional $51,112 |
| Immigrants | Spain | 99.9 /100 | #67 | Exceptional $51,092 |
| Paraguayans | 99.9 /100 | #68 | Exceptional $51,068 |
| Mongolians | 99.8 /100 | #69 | Exceptional $51,038 |
| Lithuanians | 99.8 /100 | #70 | Exceptional $50,991 |
| Immigrants | Ukraine | 99.8 /100 | #71 | Exceptional $50,984 |
| Immigrants | Egypt | 99.8 /100 | #72 | Exceptional $50,901 |
| Immigrants | Netherlands | 99.8 /100 | #73 | Exceptional $50,818 |
| South Africans | 99.8 /100 | #74 | Exceptional $50,752 |
| Immigrants | Scotland | 99.8 /100 | #75 | Exceptional $50,741 |