Immigrants from Scotland vs Kenyan Median Earnings
COMPARE
Immigrants from Scotland
Kenyan
Median Earnings
Median Earnings Comparison
Immigrants from Scotland
Kenyans
$50,741
MEDIAN EARNINGS
99.8/ 100
METRIC RATING
75th/ 347
METRIC RANK
$46,462
MEDIAN EARNINGS
51.0/ 100
METRIC RATING
172nd/ 347
METRIC RANK
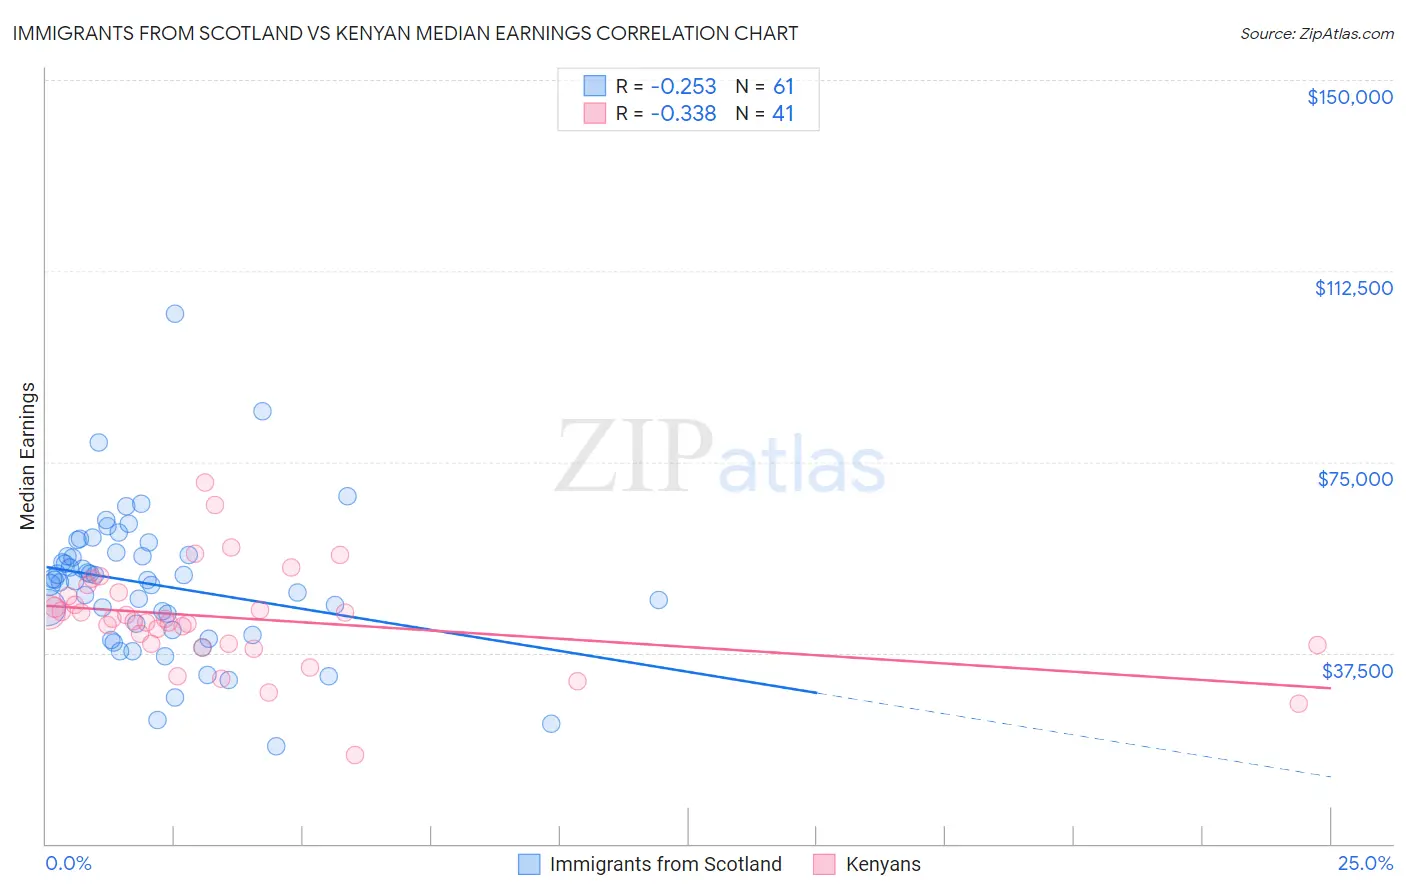
Immigrants from Scotland vs Kenyan Median Earnings Correlation Chart
The statistical analysis conducted on geographies consisting of 196,389,390 people shows a weak negative correlation between the proportion of Immigrants from Scotland and median earnings in the United States with a correlation coefficient (R) of -0.253 and weighted average of $50,741. Similarly, the statistical analysis conducted on geographies consisting of 168,231,616 people shows a mild negative correlation between the proportion of Kenyans and median earnings in the United States with a correlation coefficient (R) of -0.338 and weighted average of $46,462, a difference of 9.2%.
Median Earnings Correlation Summary
| Measurement | Immigrants from Scotland | Kenyan |
| Minimum | $19,118 | $17,500 |
| Maximum | $104,015 | $70,848 |
| Range | $84,897 | $53,348 |
| Mean | $50,819 | $44,292 |
| Median | $51,683 | $44,246 |
| Interquartile 25% (IQ1) | $41,420 | $39,165 |
| Interquartile 75% (IQ3) | $56,954 | $49,031 |
| Interquartile Range (IQR) | $15,534 | $9,866 |
| Standard Deviation (Sample) | $14,157 | $9,917 |
| Standard Deviation (Population) | $14,040 | $9,795 |
Similar Demographics by Median Earnings
Demographics Similar to Immigrants from Scotland by Median Earnings
In terms of median earnings, the demographic groups most similar to Immigrants from Scotland are South African ($50,752, a difference of 0.020%), Immigrants from Netherlands ($50,818, a difference of 0.15%), Immigrants from Egypt ($50,901, a difference of 0.32%), Immigrants from Italy ($50,581, a difference of 0.32%), and Immigrants from Western Europe ($50,549, a difference of 0.38%).
| Demographics | Rating | Rank | Median Earnings |
| Paraguayans | 99.9 /100 | #68 | Exceptional $51,068 |
| Mongolians | 99.8 /100 | #69 | Exceptional $51,038 |
| Lithuanians | 99.8 /100 | #70 | Exceptional $50,991 |
| Immigrants | Ukraine | 99.8 /100 | #71 | Exceptional $50,984 |
| Immigrants | Egypt | 99.8 /100 | #72 | Exceptional $50,901 |
| Immigrants | Netherlands | 99.8 /100 | #73 | Exceptional $50,818 |
| South Africans | 99.8 /100 | #74 | Exceptional $50,752 |
| Immigrants | Scotland | 99.8 /100 | #75 | Exceptional $50,741 |
| Immigrants | Italy | 99.7 /100 | #76 | Exceptional $50,581 |
| Immigrants | Western Europe | 99.7 /100 | #77 | Exceptional $50,549 |
| Argentineans | 99.6 /100 | #78 | Exceptional $50,399 |
| Laotians | 99.6 /100 | #79 | Exceptional $50,343 |
| Ukrainians | 99.6 /100 | #80 | Exceptional $50,320 |
| Immigrants | Southern Europe | 99.6 /100 | #81 | Exceptional $50,280 |
| Immigrants | Moldova | 99.5 /100 | #82 | Exceptional $50,274 |
Demographics Similar to Kenyans by Median Earnings
In terms of median earnings, the demographic groups most similar to Kenyans are Scottish ($46,463, a difference of 0.0%), Immigrants ($46,478, a difference of 0.030%), Ghanaian ($46,440, a difference of 0.050%), Scandinavian ($46,433, a difference of 0.060%), and Basque ($46,399, a difference of 0.14%).
| Demographics | Rating | Rank | Median Earnings |
| South Americans | 62.7 /100 | #165 | Good $46,804 |
| Czechoslovakians | 57.8 /100 | #166 | Average $46,658 |
| Costa Ricans | 57.4 /100 | #167 | Average $46,645 |
| Immigrants | Africa | 54.6 /100 | #168 | Average $46,564 |
| Immigrants | South America | 54.0 /100 | #169 | Average $46,548 |
| Immigrants | Immigrants | 51.6 /100 | #170 | Average $46,478 |
| Scottish | 51.1 /100 | #171 | Average $46,463 |
| Kenyans | 51.0 /100 | #172 | Average $46,462 |
| Ghanaians | 50.3 /100 | #173 | Average $46,440 |
| Scandinavians | 50.0 /100 | #174 | Average $46,433 |
| Basques | 48.8 /100 | #175 | Average $46,399 |
| Danes | 48.6 /100 | #176 | Average $46,392 |
| Belgians | 48.0 /100 | #177 | Average $46,375 |
| Colombians | 47.1 /100 | #178 | Average $46,349 |
| English | 46.5 /100 | #179 | Average $46,334 |