Immigrants from Scotland vs Icelander Unemployment Among Youth under 25 years
COMPARE
Immigrants from Scotland
Icelander
Unemployment Among Youth under 25 years
Unemployment Among Youth under 25 years Comparison
Immigrants from Scotland
Icelanders
11.4%
UNEMPLOYMENT AMONG YOUTH UNDER 25 YEARS
89.2/ 100
METRIC RATING
119th/ 347
METRIC RANK
11.2%
UNEMPLOYMENT AMONG YOUTH UNDER 25 YEARS
96.3/ 100
METRIC RATING
81st/ 347
METRIC RANK
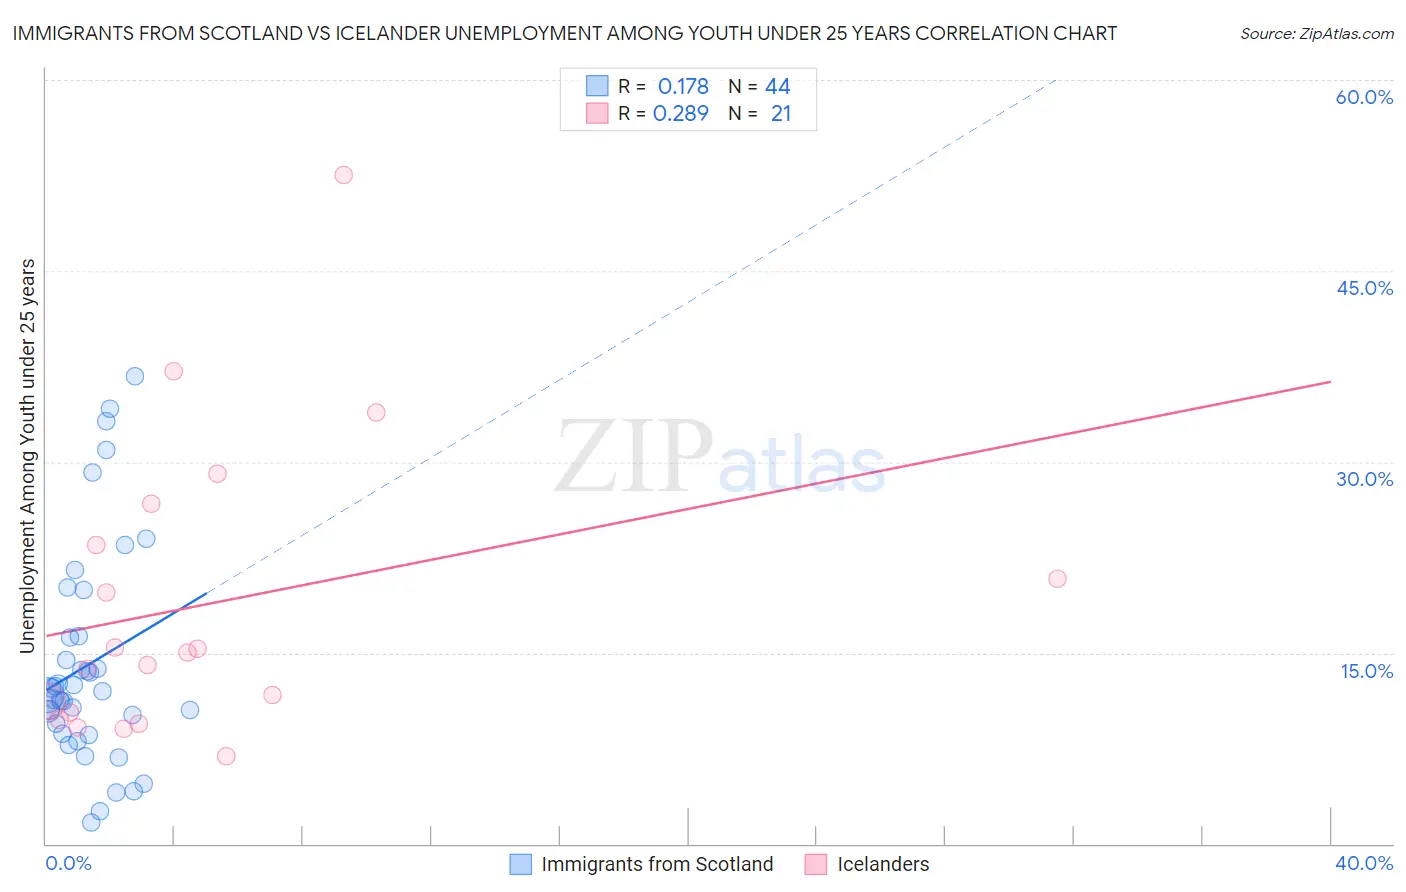
Immigrants from Scotland vs Icelander Unemployment Among Youth under 25 years Correlation Chart
The statistical analysis conducted on geographies consisting of 195,015,397 people shows a poor positive correlation between the proportion of Immigrants from Scotland and unemployment rate among youth under the age of 25 in the United States with a correlation coefficient (R) of 0.178 and weighted average of 11.4%. Similarly, the statistical analysis conducted on geographies consisting of 158,460,646 people shows a weak positive correlation between the proportion of Icelanders and unemployment rate among youth under the age of 25 in the United States with a correlation coefficient (R) of 0.289 and weighted average of 11.2%, a difference of 1.2%.
Unemployment Among Youth under 25 years Correlation Summary
| Measurement | Immigrants from Scotland | Icelander |
| Minimum | 1.7% | 6.9% |
| Maximum | 36.7% | 52.5% |
| Range | 35.0% | 45.6% |
| Mean | 14.1% | 18.8% |
| Median | 11.9% | 15.0% |
| Interquartile 25% (IQ1) | 9.1% | 10.0% |
| Interquartile 75% (IQ3) | 16.3% | 25.1% |
| Interquartile Range (IQR) | 7.2% | 15.1% |
| Standard Deviation (Sample) | 8.5% | 11.5% |
| Standard Deviation (Population) | 8.4% | 11.3% |
Similar Demographics by Unemployment Among Youth under 25 years
Demographics Similar to Immigrants from Scotland by Unemployment Among Youth under 25 years
In terms of unemployment among youth under 25 years, the demographic groups most similar to Immigrants from Scotland are Malaysian (11.4%, a difference of 0.020%), Slovak (11.4%, a difference of 0.040%), Afghan (11.3%, a difference of 0.050%), Sri Lankan (11.3%, a difference of 0.060%), and Immigrants from Vietnam (11.3%, a difference of 0.070%).
| Demographics | Rating | Rank | Unemployment Among Youth under 25 years |
| Immigrants | Austria | 90.3 /100 | #112 | Exceptional 11.3% |
| Fijians | 90.2 /100 | #113 | Exceptional 11.3% |
| Immigrants | Ethiopia | 89.9 /100 | #114 | Excellent 11.3% |
| Immigrants | Vietnam | 89.9 /100 | #115 | Excellent 11.3% |
| Burmese | 89.8 /100 | #116 | Excellent 11.3% |
| Sri Lankans | 89.8 /100 | #117 | Excellent 11.3% |
| Afghans | 89.7 /100 | #118 | Excellent 11.3% |
| Immigrants | Scotland | 89.2 /100 | #119 | Excellent 11.4% |
| Malaysians | 89.0 /100 | #120 | Excellent 11.4% |
| Slovaks | 88.9 /100 | #121 | Excellent 11.4% |
| Immigrants | Micronesia | 88.1 /100 | #122 | Excellent 11.4% |
| Basques | 87.8 /100 | #123 | Excellent 11.4% |
| Italians | 87.2 /100 | #124 | Excellent 11.4% |
| Immigrants | Argentina | 87.2 /100 | #125 | Excellent 11.4% |
| Canadians | 86.6 /100 | #126 | Excellent 11.4% |
Demographics Similar to Icelanders by Unemployment Among Youth under 25 years
In terms of unemployment among youth under 25 years, the demographic groups most similar to Icelanders are Northern European (11.2%, a difference of 0.010%), Immigrants from Bulgaria (11.2%, a difference of 0.050%), Bolivian (11.2%, a difference of 0.060%), French Canadian (11.2%, a difference of 0.10%), and Immigrants from South Central Asia (11.2%, a difference of 0.11%).
| Demographics | Rating | Rank | Unemployment Among Youth under 25 years |
| New Zealanders | 97.2 /100 | #74 | Exceptional 11.2% |
| French | 97.1 /100 | #75 | Exceptional 11.2% |
| German Russians | 97.0 /100 | #76 | Exceptional 11.2% |
| Whites/Caucasians | 96.9 /100 | #77 | Exceptional 11.2% |
| Immigrants | Nicaragua | 96.7 /100 | #78 | Exceptional 11.2% |
| Immigrants | Canada | 96.7 /100 | #79 | Exceptional 11.2% |
| Immigrants | Bulgaria | 96.4 /100 | #80 | Exceptional 11.2% |
| Icelanders | 96.3 /100 | #81 | Exceptional 11.2% |
| Northern Europeans | 96.2 /100 | #82 | Exceptional 11.2% |
| Bolivians | 96.1 /100 | #83 | Exceptional 11.2% |
| French Canadians | 95.9 /100 | #84 | Exceptional 11.2% |
| Immigrants | South Central Asia | 95.9 /100 | #85 | Exceptional 11.2% |
| Immigrants | South Africa | 95.8 /100 | #86 | Exceptional 11.2% |
| Kenyans | 95.7 /100 | #87 | Exceptional 11.2% |
| Austrians | 95.5 /100 | #88 | Exceptional 11.2% |