Immigrants from Romania vs British West Indian Median Earnings
COMPARE
Immigrants from Romania
British West Indian
Median Earnings
Median Earnings Comparison
Immigrants from Romania
British West Indians
$51,337
MEDIAN EARNINGS
99.9/ 100
METRIC RATING
62nd/ 347
METRIC RANK
$44,552
MEDIAN EARNINGS
6.7/ 100
METRIC RATING
236th/ 347
METRIC RANK
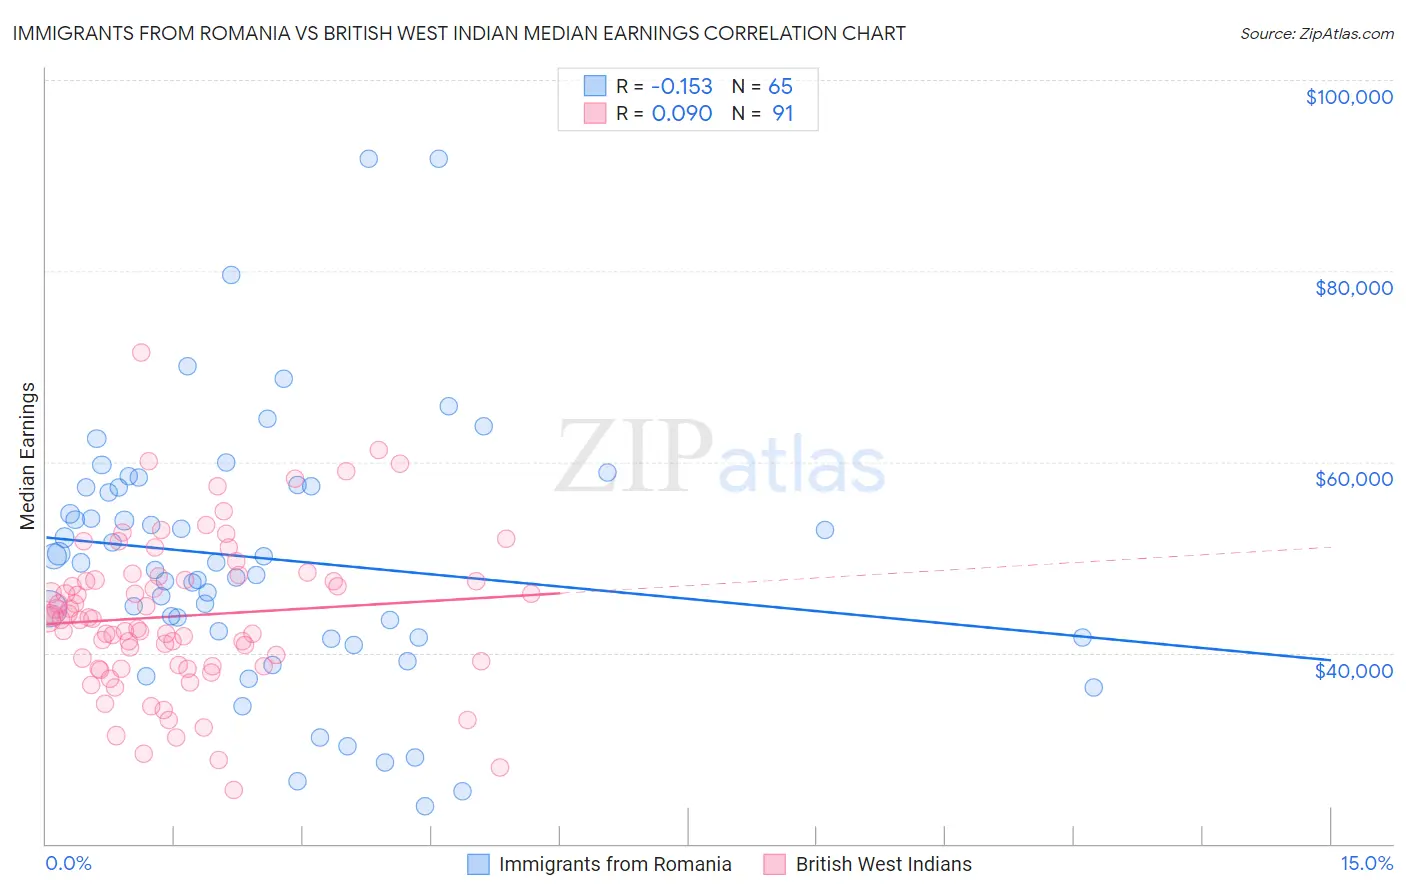
Immigrants from Romania vs British West Indian Median Earnings Correlation Chart
The statistical analysis conducted on geographies consisting of 257,003,110 people shows a poor negative correlation between the proportion of Immigrants from Romania and median earnings in the United States with a correlation coefficient (R) of -0.153 and weighted average of $51,337. Similarly, the statistical analysis conducted on geographies consisting of 152,701,918 people shows a slight positive correlation between the proportion of British West Indians and median earnings in the United States with a correlation coefficient (R) of 0.090 and weighted average of $44,552, a difference of 15.2%.
Median Earnings Correlation Summary
| Measurement | Immigrants from Romania | British West Indian |
| Minimum | $23,864 | $25,617 |
| Maximum | $91,786 | $71,446 |
| Range | $67,922 | $45,829 |
| Mean | $49,856 | $43,859 |
| Median | $49,415 | $43,512 |
| Interquartile 25% (IQ1) | $41,640 | $38,648 |
| Interquartile 75% (IQ3) | $57,433 | $47,645 |
| Interquartile Range (IQR) | $15,793 | $8,997 |
| Standard Deviation (Sample) | $13,572 | $7,987 |
| Standard Deviation (Population) | $13,467 | $7,943 |
Similar Demographics by Median Earnings
Demographics Similar to Immigrants from Romania by Median Earnings
In terms of median earnings, the demographic groups most similar to Immigrants from Romania are Immigrants from Bulgaria ($51,318, a difference of 0.040%), New Zealander ($51,246, a difference of 0.18%), Greek ($51,164, a difference of 0.34%), Immigrants from Latvia ($51,555, a difference of 0.42%), and Immigrants from Serbia ($51,557, a difference of 0.43%).
| Demographics | Rating | Rank | Median Earnings |
| Egyptians | 99.9 /100 | #55 | Exceptional $51,701 |
| Immigrants | Pakistan | 99.9 /100 | #56 | Exceptional $51,693 |
| Immigrants | Eastern Europe | 99.9 /100 | #57 | Exceptional $51,624 |
| Immigrants | Bolivia | 99.9 /100 | #58 | Exceptional $51,605 |
| Immigrants | Croatia | 99.9 /100 | #59 | Exceptional $51,581 |
| Immigrants | Serbia | 99.9 /100 | #60 | Exceptional $51,557 |
| Immigrants | Latvia | 99.9 /100 | #61 | Exceptional $51,555 |
| Immigrants | Romania | 99.9 /100 | #62 | Exceptional $51,337 |
| Immigrants | Bulgaria | 99.9 /100 | #63 | Exceptional $51,318 |
| New Zealanders | 99.9 /100 | #64 | Exceptional $51,246 |
| Greeks | 99.9 /100 | #65 | Exceptional $51,164 |
| Afghans | 99.9 /100 | #66 | Exceptional $51,112 |
| Immigrants | Spain | 99.9 /100 | #67 | Exceptional $51,092 |
| Paraguayans | 99.9 /100 | #68 | Exceptional $51,068 |
| Mongolians | 99.8 /100 | #69 | Exceptional $51,038 |
Demographics Similar to British West Indians by Median Earnings
In terms of median earnings, the demographic groups most similar to British West Indians are Venezuelan ($44,580, a difference of 0.060%), Cape Verdean ($44,640, a difference of 0.20%), Immigrants from Ecuador ($44,462, a difference of 0.20%), Sudanese ($44,419, a difference of 0.30%), and Senegalese ($44,373, a difference of 0.40%).
| Demographics | Rating | Rank | Median Earnings |
| Scotch-Irish | 10.7 /100 | #229 | Poor $44,924 |
| Immigrants | Western Africa | 10.3 /100 | #230 | Poor $44,893 |
| Japanese | 9.5 /100 | #231 | Tragic $44,825 |
| Delaware | 9.0 /100 | #232 | Tragic $44,783 |
| Immigrants | Sudan | 8.8 /100 | #233 | Tragic $44,767 |
| Cape Verdeans | 7.5 /100 | #234 | Tragic $44,640 |
| Venezuelans | 6.9 /100 | #235 | Tragic $44,580 |
| British West Indians | 6.7 /100 | #236 | Tragic $44,552 |
| Immigrants | Ecuador | 5.9 /100 | #237 | Tragic $44,462 |
| Sudanese | 5.6 /100 | #238 | Tragic $44,419 |
| Senegalese | 5.3 /100 | #239 | Tragic $44,373 |
| Aleuts | 4.4 /100 | #240 | Tragic $44,241 |
| Samoans | 4.2 /100 | #241 | Tragic $44,206 |
| Immigrants | Venezuela | 4.0 /100 | #242 | Tragic $44,163 |
| Sub-Saharan Africans | 3.7 /100 | #243 | Tragic $44,118 |