Immigrants from Romania vs British West Indian Professional Degree
COMPARE
Immigrants from Romania
British West Indian
Professional Degree
Professional Degree Comparison
Immigrants from Romania
British West Indians
5.4%
PROFESSIONAL DEGREE
99.8/ 100
METRIC RATING
73rd/ 347
METRIC RANK
3.8%
PROFESSIONAL DEGREE
2.4/ 100
METRIC RATING
239th/ 347
METRIC RANK
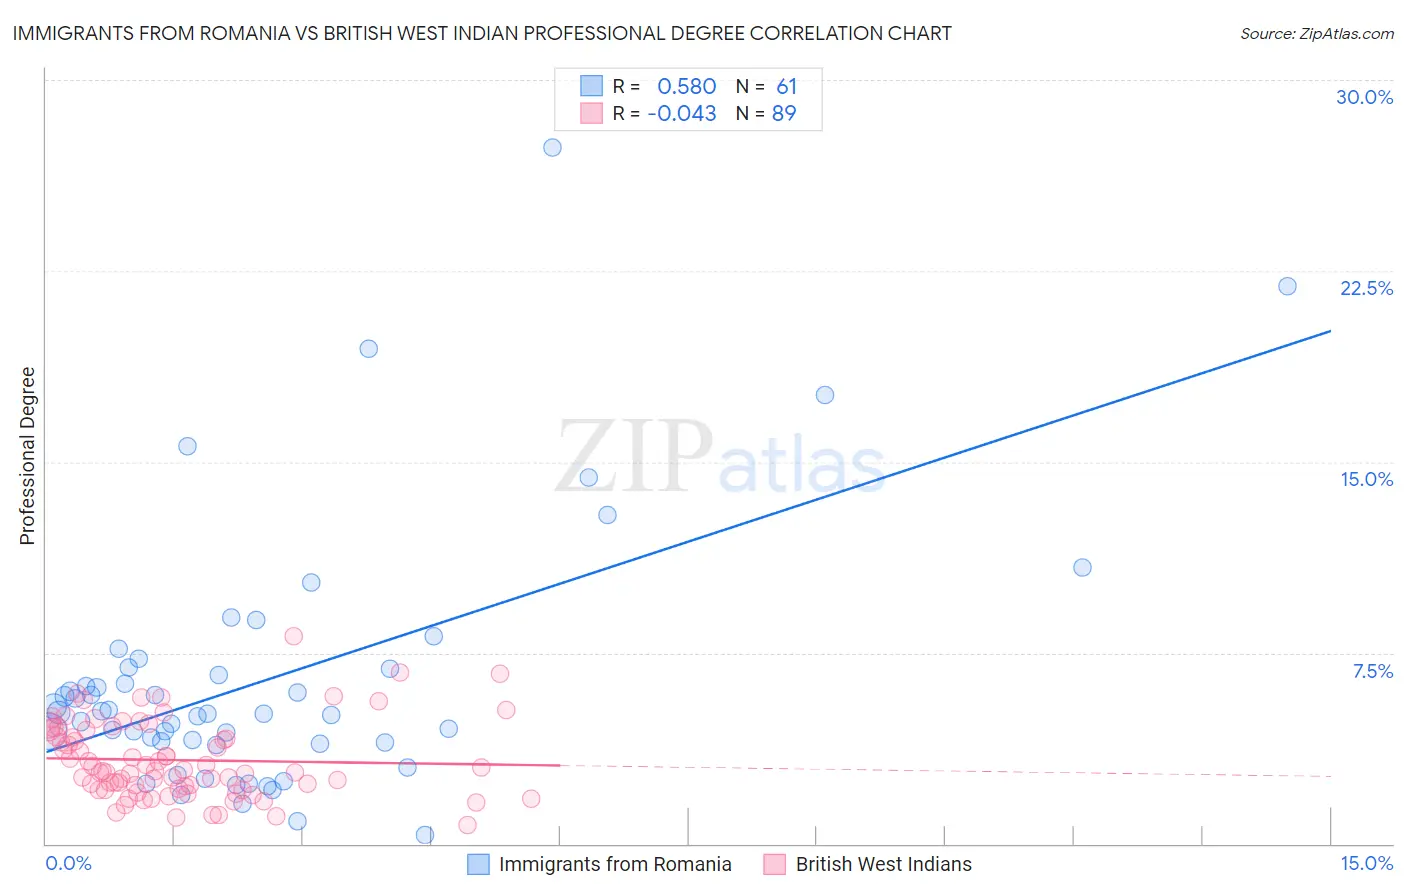
Immigrants from Romania vs British West Indian Professional Degree Correlation Chart
The statistical analysis conducted on geographies consisting of 256,846,441 people shows a substantial positive correlation between the proportion of Immigrants from Romania and percentage of population with at least professional degree education in the United States with a correlation coefficient (R) of 0.580 and weighted average of 5.4%. Similarly, the statistical analysis conducted on geographies consisting of 152,575,254 people shows no correlation between the proportion of British West Indians and percentage of population with at least professional degree education in the United States with a correlation coefficient (R) of -0.043 and weighted average of 3.8%, a difference of 41.0%.
Professional Degree Correlation Summary
| Measurement | Immigrants from Romania | British West Indian |
| Minimum | 0.34% | 0.74% |
| Maximum | 27.4% | 8.2% |
| Range | 27.0% | 7.4% |
| Mean | 6.5% | 3.3% |
| Median | 5.1% | 2.9% |
| Interquartile 25% (IQ1) | 4.0% | 2.1% |
| Interquartile 75% (IQ3) | 6.9% | 4.5% |
| Interquartile Range (IQR) | 2.9% | 2.3% |
| Standard Deviation (Sample) | 5.1% | 1.5% |
| Standard Deviation (Population) | 5.0% | 1.5% |
Similar Demographics by Professional Degree
Demographics Similar to Immigrants from Romania by Professional Degree
In terms of professional degree, the demographic groups most similar to Immigrants from Romania are Lithuanian (5.4%, a difference of 0.10%), Ethiopian (5.4%, a difference of 0.38%), Immigrants from Indonesia (5.3%, a difference of 0.51%), Immigrants from Western Asia (5.4%, a difference of 0.58%), and Immigrants from Canada (5.3%, a difference of 0.60%).
| Demographics | Rating | Rank | Professional Degree |
| Immigrants | Kazakhstan | 99.9 /100 | #66 | Exceptional 5.5% |
| Immigrants | Bulgaria | 99.9 /100 | #67 | Exceptional 5.5% |
| Immigrants | Lebanon | 99.9 /100 | #68 | Exceptional 5.5% |
| Immigrants | Hungary | 99.9 /100 | #69 | Exceptional 5.5% |
| Bhutanese | 99.8 /100 | #70 | Exceptional 5.4% |
| Immigrants | Western Asia | 99.8 /100 | #71 | Exceptional 5.4% |
| Lithuanians | 99.8 /100 | #72 | Exceptional 5.4% |
| Immigrants | Romania | 99.8 /100 | #73 | Exceptional 5.4% |
| Ethiopians | 99.7 /100 | #74 | Exceptional 5.4% |
| Immigrants | Indonesia | 99.7 /100 | #75 | Exceptional 5.3% |
| Immigrants | Canada | 99.7 /100 | #76 | Exceptional 5.3% |
| Immigrants | Ethiopia | 99.7 /100 | #77 | Exceptional 5.3% |
| Armenians | 99.7 /100 | #78 | Exceptional 5.3% |
| Immigrants | North America | 99.7 /100 | #79 | Exceptional 5.3% |
| Immigrants | England | 99.6 /100 | #80 | Exceptional 5.3% |
Demographics Similar to British West Indians by Professional Degree
In terms of professional degree, the demographic groups most similar to British West Indians are Immigrants from Ecuador (3.8%, a difference of 0.23%), Alaskan Athabascan (3.8%, a difference of 0.25%), Native Hawaiian (3.8%, a difference of 0.25%), Guamanian/Chamorro (3.8%, a difference of 0.33%), and Colville (3.8%, a difference of 0.39%).
| Demographics | Rating | Rank | Professional Degree |
| Cree | 4.3 /100 | #232 | Tragic 3.9% |
| Immigrants | Philippines | 4.1 /100 | #233 | Tragic 3.9% |
| Immigrants | Nonimmigrants | 4.0 /100 | #234 | Tragic 3.9% |
| Immigrants | Barbados | 4.0 /100 | #235 | Tragic 3.9% |
| Spanish Americans | 3.8 /100 | #236 | Tragic 3.9% |
| Immigrants | Trinidad and Tobago | 3.8 /100 | #237 | Tragic 3.9% |
| Colville | 2.6 /100 | #238 | Tragic 3.8% |
| British West Indians | 2.4 /100 | #239 | Tragic 3.8% |
| Immigrants | Ecuador | 2.3 /100 | #240 | Tragic 3.8% |
| Alaskan Athabascans | 2.3 /100 | #241 | Tragic 3.8% |
| Native Hawaiians | 2.3 /100 | #242 | Tragic 3.8% |
| Guamanians/Chamorros | 2.2 /100 | #243 | Tragic 3.8% |
| Immigrants | Bahamas | 2.0 /100 | #244 | Tragic 3.8% |
| French American Indians | 1.7 /100 | #245 | Tragic 3.8% |
| Marshallese | 1.7 /100 | #246 | Tragic 3.8% |