Immigrants from Colombia vs British West Indian Median Earnings
COMPARE
Immigrants from Colombia
British West Indian
Median Earnings
Median Earnings Comparison
Immigrants from Colombia
British West Indians
$45,550
MEDIAN EARNINGS
22.4/ 100
METRIC RATING
213th/ 347
METRIC RANK
$44,552
MEDIAN EARNINGS
6.7/ 100
METRIC RATING
236th/ 347
METRIC RANK
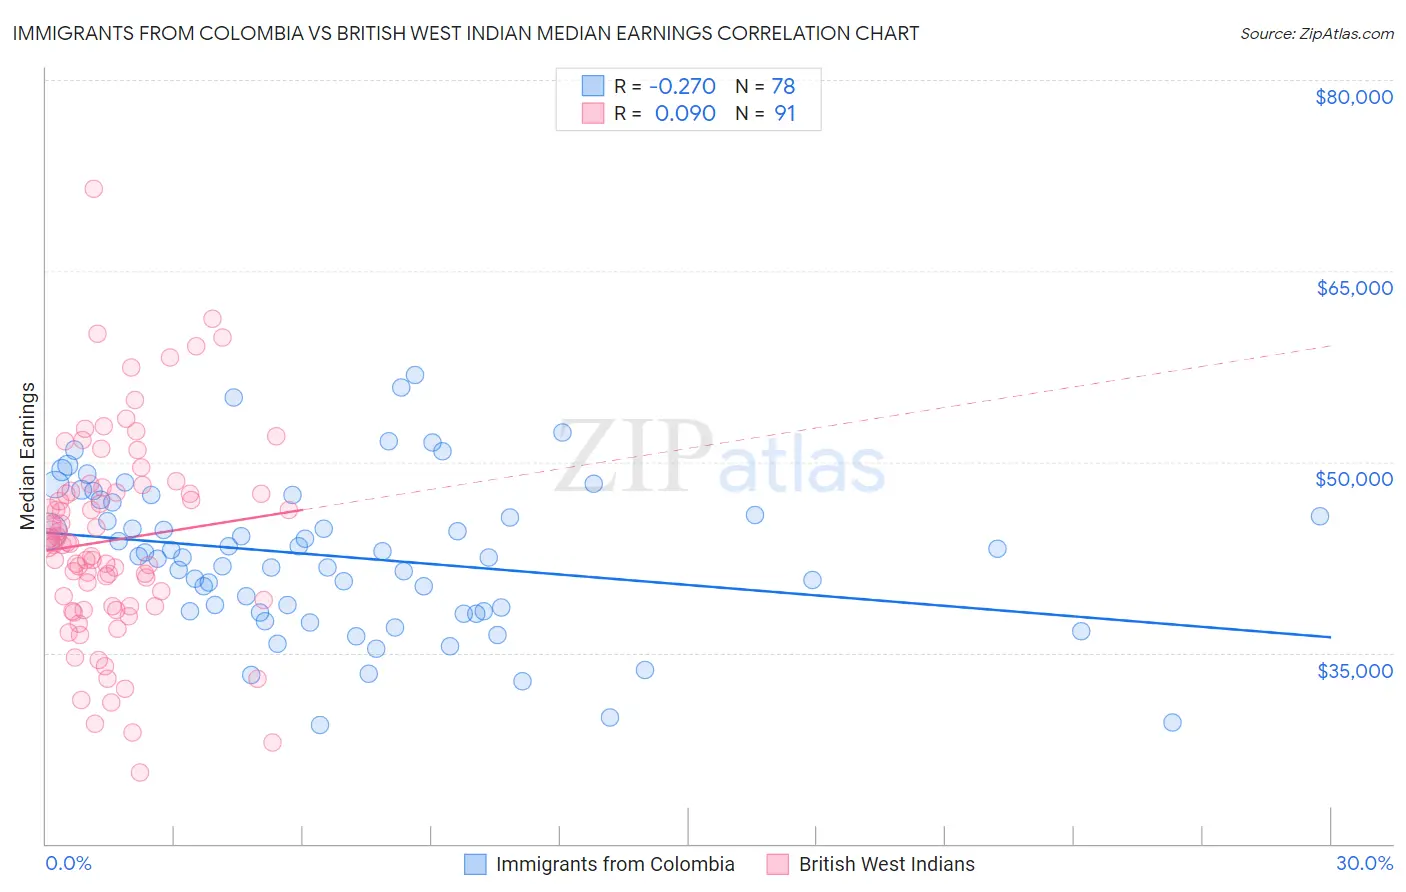
Immigrants from Colombia vs British West Indian Median Earnings Correlation Chart
The statistical analysis conducted on geographies consisting of 378,647,626 people shows a weak negative correlation between the proportion of Immigrants from Colombia and median earnings in the United States with a correlation coefficient (R) of -0.270 and weighted average of $45,550. Similarly, the statistical analysis conducted on geographies consisting of 152,701,918 people shows a slight positive correlation between the proportion of British West Indians and median earnings in the United States with a correlation coefficient (R) of 0.090 and weighted average of $44,552, a difference of 2.2%.
Median Earnings Correlation Summary
| Measurement | Immigrants from Colombia | British West Indian |
| Minimum | $29,284 | $25,617 |
| Maximum | $56,800 | $71,446 |
| Range | $27,517 | $45,829 |
| Mean | $42,514 | $43,859 |
| Median | $42,568 | $43,512 |
| Interquartile 25% (IQ1) | $38,241 | $38,648 |
| Interquartile 75% (IQ3) | $46,823 | $47,645 |
| Interquartile Range (IQR) | $8,582 | $8,997 |
| Standard Deviation (Sample) | $5,984 | $7,987 |
| Standard Deviation (Population) | $5,945 | $7,943 |
Similar Demographics by Median Earnings
Demographics Similar to Immigrants from Colombia by Median Earnings
In terms of median earnings, the demographic groups most similar to Immigrants from Colombia are Nigerian ($45,532, a difference of 0.040%), Immigrants from Bangladesh ($45,532, a difference of 0.040%), Immigrants from Grenada ($45,596, a difference of 0.10%), Panamanian ($45,593, a difference of 0.10%), and Bermudan ($45,593, a difference of 0.10%).
| Demographics | Rating | Rank | Median Earnings |
| Immigrants | Ghana | 24.8 /100 | #206 | Fair $45,641 |
| Immigrants | Senegal | 24.0 /100 | #207 | Fair $45,611 |
| Immigrants | Bosnia and Herzegovina | 23.7 /100 | #208 | Fair $45,600 |
| Immigrants | Thailand | 23.7 /100 | #209 | Fair $45,598 |
| Immigrants | Grenada | 23.6 /100 | #210 | Fair $45,596 |
| Panamanians | 23.5 /100 | #211 | Fair $45,593 |
| Bermudans | 23.5 /100 | #212 | Fair $45,593 |
| Immigrants | Colombia | 22.4 /100 | #213 | Fair $45,550 |
| Nigerians | 22.0 /100 | #214 | Fair $45,532 |
| Immigrants | Bangladesh | 22.0 /100 | #215 | Fair $45,532 |
| Guyanese | 20.6 /100 | #216 | Fair $45,470 |
| Tlingit-Haida | 20.5 /100 | #217 | Fair $45,468 |
| Spanish | 19.7 /100 | #218 | Poor $45,432 |
| Dutch | 18.4 /100 | #219 | Poor $45,370 |
| Ecuadorians | 15.3 /100 | #220 | Poor $45,214 |
Demographics Similar to British West Indians by Median Earnings
In terms of median earnings, the demographic groups most similar to British West Indians are Venezuelan ($44,580, a difference of 0.060%), Cape Verdean ($44,640, a difference of 0.20%), Immigrants from Ecuador ($44,462, a difference of 0.20%), Sudanese ($44,419, a difference of 0.30%), and Senegalese ($44,373, a difference of 0.40%).
| Demographics | Rating | Rank | Median Earnings |
| Scotch-Irish | 10.7 /100 | #229 | Poor $44,924 |
| Immigrants | Western Africa | 10.3 /100 | #230 | Poor $44,893 |
| Japanese | 9.5 /100 | #231 | Tragic $44,825 |
| Delaware | 9.0 /100 | #232 | Tragic $44,783 |
| Immigrants | Sudan | 8.8 /100 | #233 | Tragic $44,767 |
| Cape Verdeans | 7.5 /100 | #234 | Tragic $44,640 |
| Venezuelans | 6.9 /100 | #235 | Tragic $44,580 |
| British West Indians | 6.7 /100 | #236 | Tragic $44,552 |
| Immigrants | Ecuador | 5.9 /100 | #237 | Tragic $44,462 |
| Sudanese | 5.6 /100 | #238 | Tragic $44,419 |
| Senegalese | 5.3 /100 | #239 | Tragic $44,373 |
| Aleuts | 4.4 /100 | #240 | Tragic $44,241 |
| Samoans | 4.2 /100 | #241 | Tragic $44,206 |
| Immigrants | Venezuela | 4.0 /100 | #242 | Tragic $44,163 |
| Sub-Saharan Africans | 3.7 /100 | #243 | Tragic $44,118 |