Immigrants from El Salvador vs British West Indian Median Earnings
COMPARE
Immigrants from El Salvador
British West Indian
Median Earnings
Median Earnings Comparison
Immigrants from El Salvador
British West Indians
$42,413
MEDIAN EARNINGS
0.4/ 100
METRIC RATING
274th/ 347
METRIC RANK
$44,552
MEDIAN EARNINGS
6.7/ 100
METRIC RATING
236th/ 347
METRIC RANK
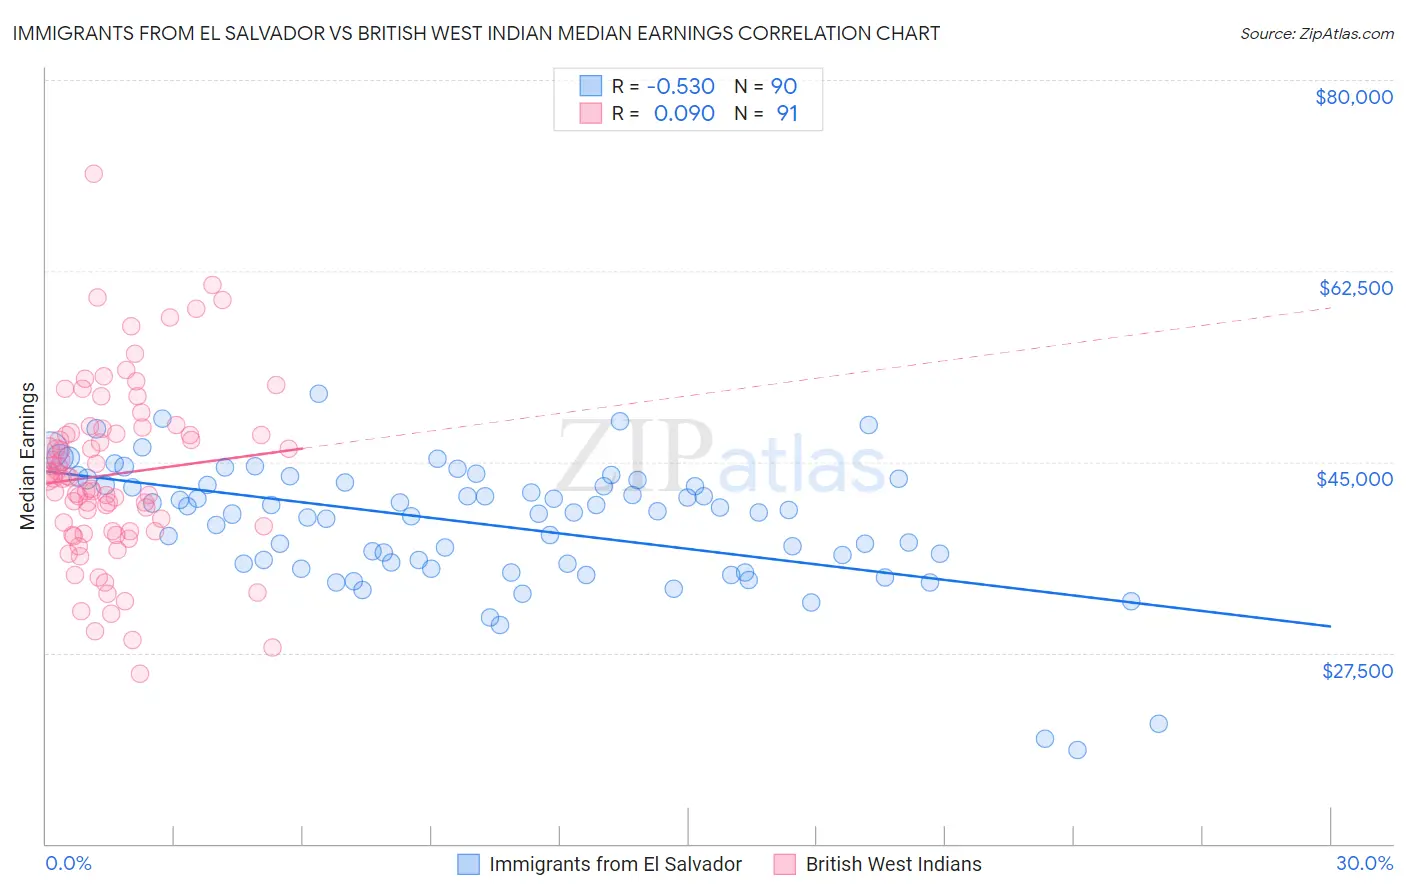
Immigrants from El Salvador vs British West Indian Median Earnings Correlation Chart
The statistical analysis conducted on geographies consisting of 357,819,610 people shows a substantial negative correlation between the proportion of Immigrants from El Salvador and median earnings in the United States with a correlation coefficient (R) of -0.530 and weighted average of $42,413. Similarly, the statistical analysis conducted on geographies consisting of 152,701,918 people shows a slight positive correlation between the proportion of British West Indians and median earnings in the United States with a correlation coefficient (R) of 0.090 and weighted average of $44,552, a difference of 5.0%.
Median Earnings Correlation Summary
| Measurement | Immigrants from El Salvador | British West Indian |
| Minimum | $18,605 | $25,617 |
| Maximum | $51,289 | $71,446 |
| Range | $32,684 | $45,829 |
| Mean | $39,285 | $43,859 |
| Median | $40,413 | $43,512 |
| Interquartile 25% (IQ1) | $35,635 | $38,648 |
| Interquartile 75% (IQ3) | $43,130 | $47,645 |
| Interquartile Range (IQR) | $7,494 | $8,997 |
| Standard Deviation (Sample) | $5,807 | $7,987 |
| Standard Deviation (Population) | $5,775 | $7,943 |
Similar Demographics by Median Earnings
Demographics Similar to Immigrants from El Salvador by Median Earnings
In terms of median earnings, the demographic groups most similar to Immigrants from El Salvador are Immigrants from Dominica ($42,420, a difference of 0.020%), Iroquois ($42,430, a difference of 0.040%), Immigrants from Belize ($42,339, a difference of 0.18%), Spanish American ($42,316, a difference of 0.23%), and Central American ($42,280, a difference of 0.32%).
| Demographics | Rating | Rank | Median Earnings |
| Cree | 0.6 /100 | #267 | Tragic $42,777 |
| Americans | 0.6 /100 | #268 | Tragic $42,742 |
| Belizeans | 0.5 /100 | #269 | Tragic $42,702 |
| Osage | 0.5 /100 | #270 | Tragic $42,651 |
| Pennsylvania Germans | 0.5 /100 | #271 | Tragic $42,615 |
| Iroquois | 0.4 /100 | #272 | Tragic $42,430 |
| Immigrants | Dominica | 0.4 /100 | #273 | Tragic $42,420 |
| Immigrants | El Salvador | 0.4 /100 | #274 | Tragic $42,413 |
| Immigrants | Belize | 0.3 /100 | #275 | Tragic $42,339 |
| Spanish Americans | 0.3 /100 | #276 | Tragic $42,316 |
| Central Americans | 0.3 /100 | #277 | Tragic $42,280 |
| Cajuns | 0.3 /100 | #278 | Tragic $42,189 |
| Colville | 0.2 /100 | #279 | Tragic $42,151 |
| Hmong | 0.2 /100 | #280 | Tragic $42,111 |
| Marshallese | 0.2 /100 | #281 | Tragic $41,969 |
Demographics Similar to British West Indians by Median Earnings
In terms of median earnings, the demographic groups most similar to British West Indians are Venezuelan ($44,580, a difference of 0.060%), Cape Verdean ($44,640, a difference of 0.20%), Immigrants from Ecuador ($44,462, a difference of 0.20%), Sudanese ($44,419, a difference of 0.30%), and Senegalese ($44,373, a difference of 0.40%).
| Demographics | Rating | Rank | Median Earnings |
| Scotch-Irish | 10.7 /100 | #229 | Poor $44,924 |
| Immigrants | Western Africa | 10.3 /100 | #230 | Poor $44,893 |
| Japanese | 9.5 /100 | #231 | Tragic $44,825 |
| Delaware | 9.0 /100 | #232 | Tragic $44,783 |
| Immigrants | Sudan | 8.8 /100 | #233 | Tragic $44,767 |
| Cape Verdeans | 7.5 /100 | #234 | Tragic $44,640 |
| Venezuelans | 6.9 /100 | #235 | Tragic $44,580 |
| British West Indians | 6.7 /100 | #236 | Tragic $44,552 |
| Immigrants | Ecuador | 5.9 /100 | #237 | Tragic $44,462 |
| Sudanese | 5.6 /100 | #238 | Tragic $44,419 |
| Senegalese | 5.3 /100 | #239 | Tragic $44,373 |
| Aleuts | 4.4 /100 | #240 | Tragic $44,241 |
| Samoans | 4.2 /100 | #241 | Tragic $44,206 |
| Immigrants | Venezuela | 4.0 /100 | #242 | Tragic $44,163 |
| Sub-Saharan Africans | 3.7 /100 | #243 | Tragic $44,118 |