Immigrants from Switzerland vs British West Indian Median Earnings
COMPARE
Immigrants from Switzerland
British West Indian
Median Earnings
Median Earnings Comparison
Immigrants from Switzerland
British West Indians
$53,211
MEDIAN EARNINGS
100.0/ 100
METRIC RATING
35th/ 347
METRIC RANK
$44,552
MEDIAN EARNINGS
6.7/ 100
METRIC RATING
236th/ 347
METRIC RANK
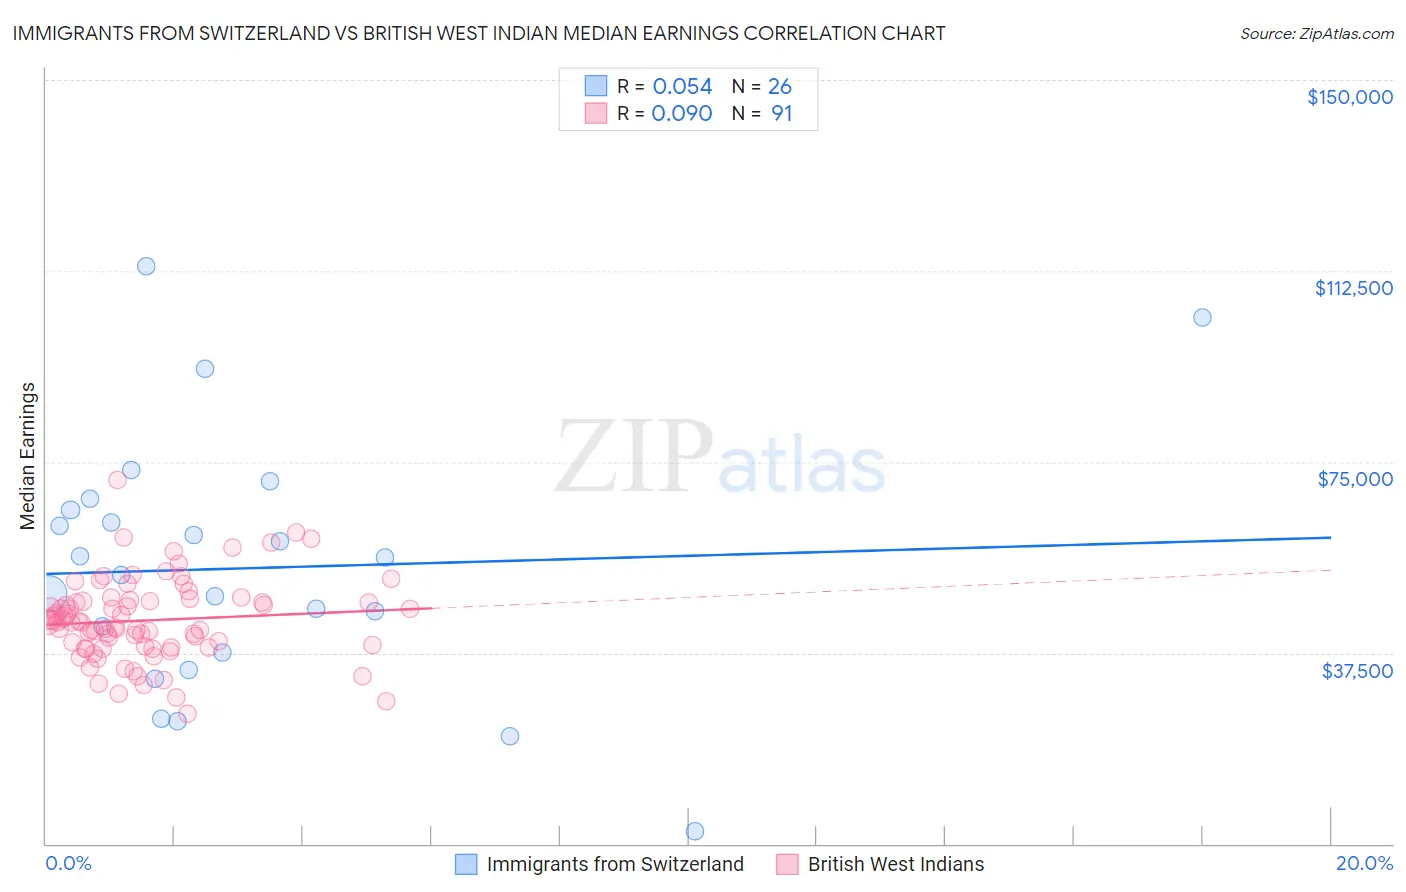
Immigrants from Switzerland vs British West Indian Median Earnings Correlation Chart
The statistical analysis conducted on geographies consisting of 148,076,857 people shows a slight positive correlation between the proportion of Immigrants from Switzerland and median earnings in the United States with a correlation coefficient (R) of 0.054 and weighted average of $53,211. Similarly, the statistical analysis conducted on geographies consisting of 152,701,918 people shows a slight positive correlation between the proportion of British West Indians and median earnings in the United States with a correlation coefficient (R) of 0.090 and weighted average of $44,552, a difference of 19.4%.
Median Earnings Correlation Summary
| Measurement | Immigrants from Switzerland | British West Indian |
| Minimum | $2,499 | $25,617 |
| Maximum | $113,419 | $71,446 |
| Range | $110,920 | $45,829 |
| Mean | $54,118 | $43,859 |
| Median | $54,480 | $43,512 |
| Interquartile 25% (IQ1) | $37,656 | $38,648 |
| Interquartile 75% (IQ3) | $65,606 | $47,645 |
| Interquartile Range (IQR) | $27,950 | $8,997 |
| Standard Deviation (Sample) | $25,059 | $7,987 |
| Standard Deviation (Population) | $24,573 | $7,943 |
Similar Demographics by Median Earnings
Demographics Similar to Immigrants from Switzerland by Median Earnings
In terms of median earnings, the demographic groups most similar to Immigrants from Switzerland are Immigrants from Denmark ($53,186, a difference of 0.050%), Immigrants from Sri Lanka ($53,268, a difference of 0.11%), Immigrants from Greece ($53,282, a difference of 0.13%), Immigrants from Asia ($53,310, a difference of 0.19%), and Russian ($53,334, a difference of 0.23%).
| Demographics | Rating | Rank | Median Earnings |
| Immigrants | France | 100.0 /100 | #28 | Exceptional $53,490 |
| Immigrants | Russia | 100.0 /100 | #29 | Exceptional $53,457 |
| Cambodians | 100.0 /100 | #30 | Exceptional $53,386 |
| Russians | 100.0 /100 | #31 | Exceptional $53,334 |
| Immigrants | Asia | 100.0 /100 | #32 | Exceptional $53,310 |
| Immigrants | Greece | 100.0 /100 | #33 | Exceptional $53,282 |
| Immigrants | Sri Lanka | 100.0 /100 | #34 | Exceptional $53,268 |
| Immigrants | Switzerland | 100.0 /100 | #35 | Exceptional $53,211 |
| Immigrants | Denmark | 100.0 /100 | #36 | Exceptional $53,186 |
| Immigrants | Belarus | 100.0 /100 | #37 | Exceptional $53,043 |
| Latvians | 100.0 /100 | #38 | Exceptional $53,001 |
| Immigrants | Turkey | 100.0 /100 | #39 | Exceptional $52,960 |
| Israelis | 100.0 /100 | #40 | Exceptional $52,937 |
| Immigrants | Lithuania | 100.0 /100 | #41 | Exceptional $52,769 |
| Maltese | 100.0 /100 | #42 | Exceptional $52,526 |
Demographics Similar to British West Indians by Median Earnings
In terms of median earnings, the demographic groups most similar to British West Indians are Venezuelan ($44,580, a difference of 0.060%), Cape Verdean ($44,640, a difference of 0.20%), Immigrants from Ecuador ($44,462, a difference of 0.20%), Sudanese ($44,419, a difference of 0.30%), and Senegalese ($44,373, a difference of 0.40%).
| Demographics | Rating | Rank | Median Earnings |
| Scotch-Irish | 10.7 /100 | #229 | Poor $44,924 |
| Immigrants | Western Africa | 10.3 /100 | #230 | Poor $44,893 |
| Japanese | 9.5 /100 | #231 | Tragic $44,825 |
| Delaware | 9.0 /100 | #232 | Tragic $44,783 |
| Immigrants | Sudan | 8.8 /100 | #233 | Tragic $44,767 |
| Cape Verdeans | 7.5 /100 | #234 | Tragic $44,640 |
| Venezuelans | 6.9 /100 | #235 | Tragic $44,580 |
| British West Indians | 6.7 /100 | #236 | Tragic $44,552 |
| Immigrants | Ecuador | 5.9 /100 | #237 | Tragic $44,462 |
| Sudanese | 5.6 /100 | #238 | Tragic $44,419 |
| Senegalese | 5.3 /100 | #239 | Tragic $44,373 |
| Aleuts | 4.4 /100 | #240 | Tragic $44,241 |
| Samoans | 4.2 /100 | #241 | Tragic $44,206 |
| Immigrants | Venezuela | 4.0 /100 | #242 | Tragic $44,163 |
| Sub-Saharan Africans | 3.7 /100 | #243 | Tragic $44,118 |