Immigrants from Panama vs Central American Professional Degree
COMPARE
Immigrants from Panama
Central American
Professional Degree
Professional Degree Comparison
Immigrants from Panama
Central Americans
4.1%
PROFESSIONAL DEGREE
12.3/ 100
METRIC RATING
209th/ 347
METRIC RANK
3.6%
PROFESSIONAL DEGREE
0.6/ 100
METRIC RATING
270th/ 347
METRIC RANK
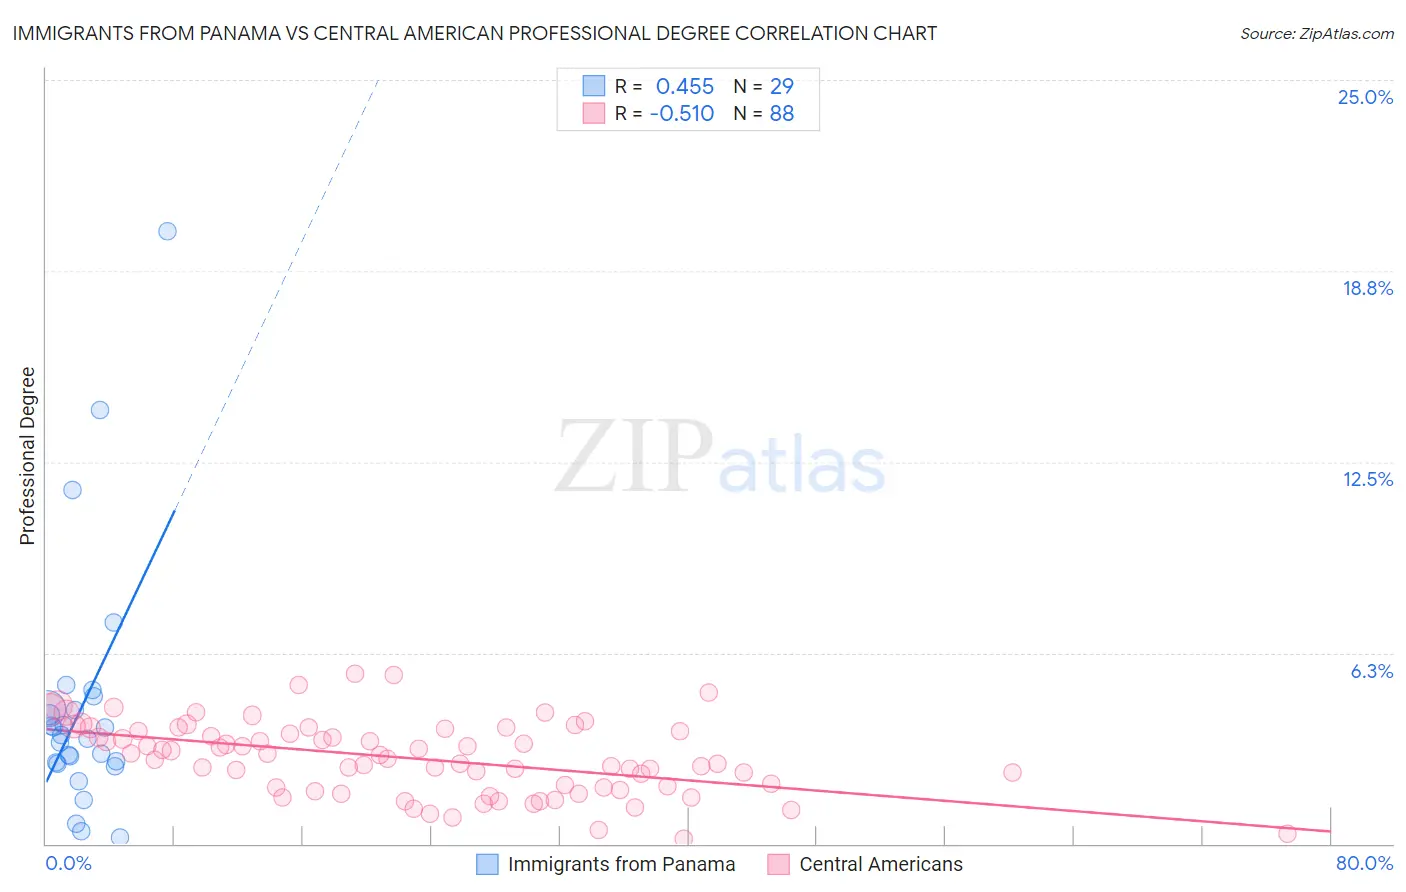
Immigrants from Panama vs Central American Professional Degree Correlation Chart
The statistical analysis conducted on geographies consisting of 221,001,104 people shows a moderate positive correlation between the proportion of Immigrants from Panama and percentage of population with at least professional degree education in the United States with a correlation coefficient (R) of 0.455 and weighted average of 4.1%. Similarly, the statistical analysis conducted on geographies consisting of 501,496,781 people shows a substantial negative correlation between the proportion of Central Americans and percentage of population with at least professional degree education in the United States with a correlation coefficient (R) of -0.510 and weighted average of 3.6%, a difference of 14.1%.
Professional Degree Correlation Summary
| Measurement | Immigrants from Panama | Central American |
| Minimum | 0.20% | 0.14% |
| Maximum | 20.0% | 5.6% |
| Range | 19.9% | 5.4% |
| Mean | 4.5% | 2.8% |
| Median | 3.6% | 2.8% |
| Interquartile 25% (IQ1) | 2.6% | 1.9% |
| Interquartile 75% (IQ3) | 4.6% | 3.7% |
| Interquartile Range (IQR) | 2.0% | 1.8% |
| Standard Deviation (Sample) | 4.2% | 1.2% |
| Standard Deviation (Population) | 4.1% | 1.2% |
Similar Demographics by Professional Degree
Demographics Similar to Immigrants from Panama by Professional Degree
In terms of professional degree, the demographic groups most similar to Immigrants from Panama are Immigrants from Somalia (4.1%, a difference of 0.080%), Subsaharan African (4.1%, a difference of 0.16%), Immigrants from Nigeria (4.1%, a difference of 0.22%), German (4.1%, a difference of 0.26%), and Yugoslavian (4.1%, a difference of 0.40%).
| Demographics | Rating | Rank | Professional Degree |
| Immigrants | Iraq | 17.1 /100 | #202 | Poor 4.2% |
| Panamanians | 15.9 /100 | #203 | Poor 4.1% |
| Barbadians | 15.8 /100 | #204 | Poor 4.1% |
| Somalis | 14.8 /100 | #205 | Poor 4.1% |
| Yugoslavians | 13.4 /100 | #206 | Poor 4.1% |
| Sub-Saharan Africans | 12.8 /100 | #207 | Poor 4.1% |
| Immigrants | Somalia | 12.5 /100 | #208 | Poor 4.1% |
| Immigrants | Panama | 12.3 /100 | #209 | Poor 4.1% |
| Immigrants | Nigeria | 11.7 /100 | #210 | Poor 4.1% |
| Germans | 11.6 /100 | #211 | Poor 4.1% |
| Whites/Caucasians | 11.2 /100 | #212 | Poor 4.1% |
| Koreans | 10.7 /100 | #213 | Poor 4.1% |
| Immigrants | Ghana | 10.6 /100 | #214 | Poor 4.1% |
| Portuguese | 10.5 /100 | #215 | Poor 4.1% |
| West Indians | 9.8 /100 | #216 | Tragic 4.1% |
Demographics Similar to Central Americans by Professional Degree
In terms of professional degree, the demographic groups most similar to Central Americans are Immigrants from Cuba (3.6%, a difference of 0.29%), Belizean (3.6%, a difference of 0.47%), Immigrants from Jamaica (3.6%, a difference of 0.49%), American (3.6%, a difference of 0.56%), and Potawatomi (3.6%, a difference of 0.69%).
| Demographics | Rating | Rank | Professional Degree |
| Hopi | 0.9 /100 | #263 | Tragic 3.6% |
| Immigrants | Cambodia | 0.9 /100 | #264 | Tragic 3.6% |
| Immigrants | Congo | 0.8 /100 | #265 | Tragic 3.6% |
| Central American Indians | 0.8 /100 | #266 | Tragic 3.6% |
| Delaware | 0.7 /100 | #267 | Tragic 3.6% |
| Aleuts | 0.7 /100 | #268 | Tragic 3.6% |
| Immigrants | Cuba | 0.6 /100 | #269 | Tragic 3.6% |
| Central Americans | 0.6 /100 | #270 | Tragic 3.6% |
| Belizeans | 0.5 /100 | #271 | Tragic 3.6% |
| Immigrants | Jamaica | 0.5 /100 | #272 | Tragic 3.6% |
| Americans | 0.5 /100 | #273 | Tragic 3.6% |
| Potawatomi | 0.5 /100 | #274 | Tragic 3.6% |
| Immigrants | Dominica | 0.5 /100 | #275 | Tragic 3.6% |
| Liberians | 0.5 /100 | #276 | Tragic 3.6% |
| Cheyenne | 0.5 /100 | #277 | Tragic 3.6% |