Immigrants from Norway vs Trinidadian and Tobagonian Median Male Earnings
COMPARE
Immigrants from Norway
Trinidadian and Tobagonian
Median Male Earnings
Median Male Earnings Comparison
Immigrants from Norway
Trinidadians and Tobagonians
$61,628
MEDIAN MALE EARNINGS
99.9/ 100
METRIC RATING
52nd/ 347
METRIC RANK
$51,446
MEDIAN MALE EARNINGS
4.8/ 100
METRIC RATING
227th/ 347
METRIC RANK
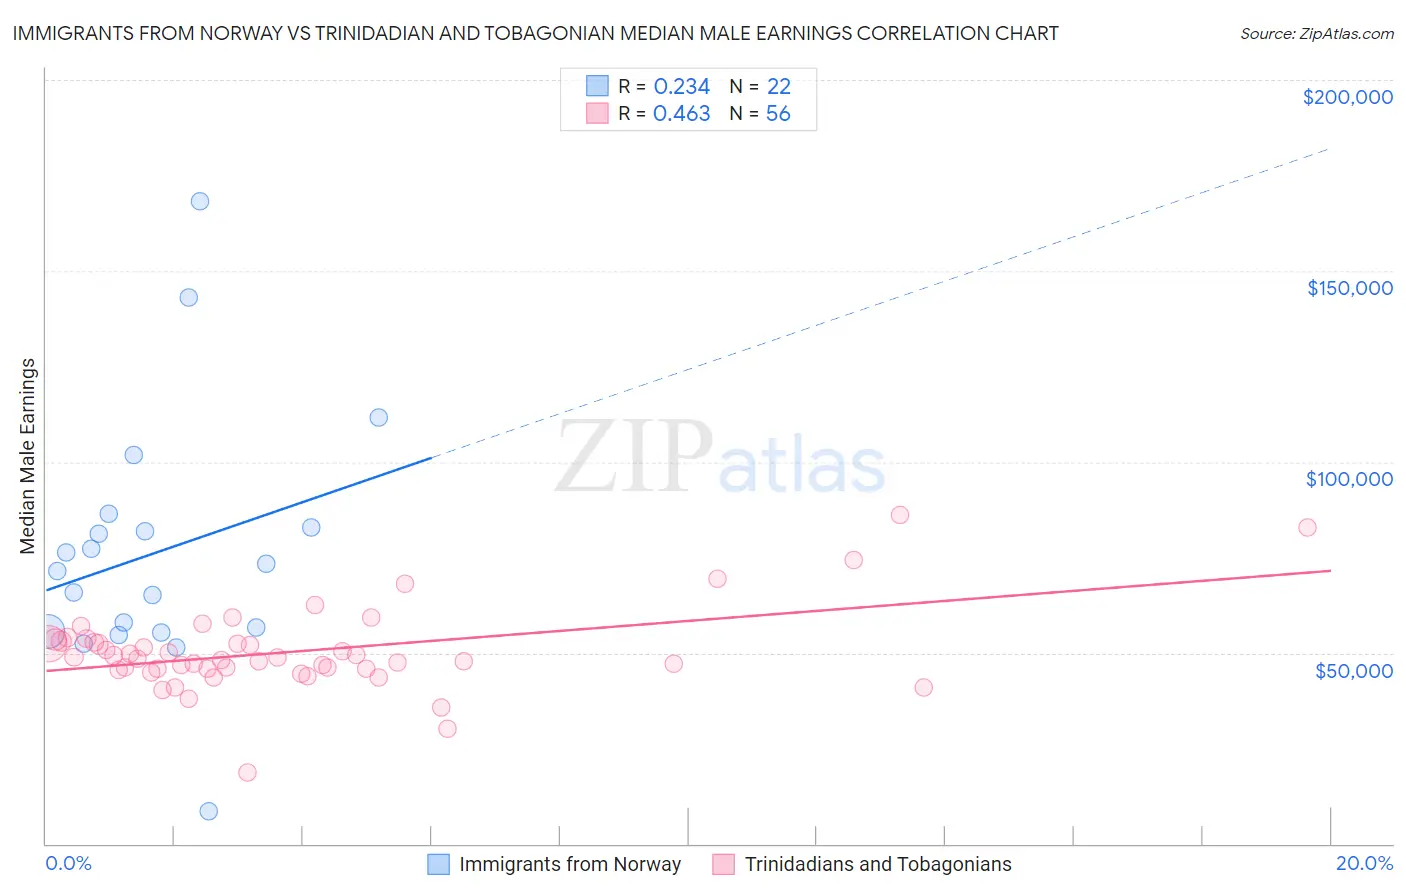
Immigrants from Norway vs Trinidadian and Tobagonian Median Male Earnings Correlation Chart
The statistical analysis conducted on geographies consisting of 116,702,945 people shows a weak positive correlation between the proportion of Immigrants from Norway and median male earnings in the United States with a correlation coefficient (R) of 0.234 and weighted average of $61,628. Similarly, the statistical analysis conducted on geographies consisting of 219,852,286 people shows a moderate positive correlation between the proportion of Trinidadians and Tobagonians and median male earnings in the United States with a correlation coefficient (R) of 0.463 and weighted average of $51,446, a difference of 19.8%.
Median Male Earnings Correlation Summary
| Measurement | Immigrants from Norway | Trinidadian and Tobagonian |
| Minimum | $8,547 | $18,666 |
| Maximum | $168,268 | $86,046 |
| Range | $159,721 | $67,380 |
| Mean | $76,311 | $50,279 |
| Median | $72,426 | $48,562 |
| Interquartile 25% (IQ1) | $55,593 | $45,885 |
| Interquartile 75% (IQ3) | $82,963 | $52,942 |
| Interquartile Range (IQR) | $27,370 | $7,058 |
| Standard Deviation (Sample) | $33,202 | $10,888 |
| Standard Deviation (Population) | $32,439 | $10,790 |
Similar Demographics by Median Male Earnings
Demographics Similar to Immigrants from Norway by Median Male Earnings
In terms of median male earnings, the demographic groups most similar to Immigrants from Norway are Estonian ($61,710, a difference of 0.13%), Bhutanese ($61,759, a difference of 0.21%), South African ($61,460, a difference of 0.27%), Immigrants from Latvia ($61,422, a difference of 0.34%), and Greek ($61,242, a difference of 0.63%).
| Demographics | Rating | Rank | Median Male Earnings |
| Bulgarians | 100.0 /100 | #45 | Exceptional $62,378 |
| Immigrants | Czechoslovakia | 99.9 /100 | #46 | Exceptional $62,217 |
| Immigrants | Austria | 99.9 /100 | #47 | Exceptional $62,164 |
| Immigrants | Malaysia | 99.9 /100 | #48 | Exceptional $62,121 |
| Immigrants | Europe | 99.9 /100 | #49 | Exceptional $62,057 |
| Bhutanese | 99.9 /100 | #50 | Exceptional $61,759 |
| Estonians | 99.9 /100 | #51 | Exceptional $61,710 |
| Immigrants | Norway | 99.9 /100 | #52 | Exceptional $61,628 |
| South Africans | 99.9 /100 | #53 | Exceptional $61,460 |
| Immigrants | Latvia | 99.9 /100 | #54 | Exceptional $61,422 |
| Greeks | 99.9 /100 | #55 | Exceptional $61,242 |
| Lithuanians | 99.9 /100 | #56 | Exceptional $61,228 |
| Immigrants | Scotland | 99.9 /100 | #57 | Exceptional $61,220 |
| New Zealanders | 99.9 /100 | #58 | Exceptional $61,199 |
| Immigrants | Netherlands | 99.8 /100 | #59 | Exceptional $61,096 |
Demographics Similar to Trinidadians and Tobagonians by Median Male Earnings
In terms of median male earnings, the demographic groups most similar to Trinidadians and Tobagonians are Japanese ($51,473, a difference of 0.050%), Immigrants from Sudan ($51,489, a difference of 0.080%), Samoan ($51,389, a difference of 0.11%), Immigrants from Trinidad and Tobago ($51,376, a difference of 0.14%), and Immigrants from Nigeria ($51,310, a difference of 0.27%).
| Demographics | Rating | Rank | Median Male Earnings |
| Immigrants | Armenia | 6.6 /100 | #220 | Tragic $51,793 |
| Immigrants | Senegal | 5.8 /100 | #221 | Tragic $51,647 |
| Immigrants | Bangladesh | 5.8 /100 | #222 | Tragic $51,642 |
| Ecuadorians | 5.5 /100 | #223 | Tragic $51,596 |
| Immigrants | Cambodia | 5.5 /100 | #224 | Tragic $51,594 |
| Immigrants | Sudan | 5.0 /100 | #225 | Tragic $51,489 |
| Japanese | 4.9 /100 | #226 | Tragic $51,473 |
| Trinidadians and Tobagonians | 4.8 /100 | #227 | Tragic $51,446 |
| Samoans | 4.6 /100 | #228 | Tragic $51,389 |
| Immigrants | Trinidad and Tobago | 4.5 /100 | #229 | Tragic $51,376 |
| Immigrants | Nigeria | 4.2 /100 | #230 | Tragic $51,310 |
| Barbadians | 3.9 /100 | #231 | Tragic $51,236 |
| Sudanese | 3.9 /100 | #232 | Tragic $51,216 |
| Aleuts | 3.7 /100 | #233 | Tragic $51,168 |
| Cape Verdeans | 3.5 /100 | #234 | Tragic $51,103 |