Immigrants from North America vs Cape Verdean Median Family Income
COMPARE
Immigrants from North America
Cape Verdean
Median Family Income
Median Family Income Comparison
Immigrants from North America
Cape Verdeans
$112,151
MEDIAN FAMILY INCOME
99.2/ 100
METRIC RATING
81st/ 347
METRIC RANK
$91,848
MEDIAN FAMILY INCOME
0.4/ 100
METRIC RATING
259th/ 347
METRIC RANK
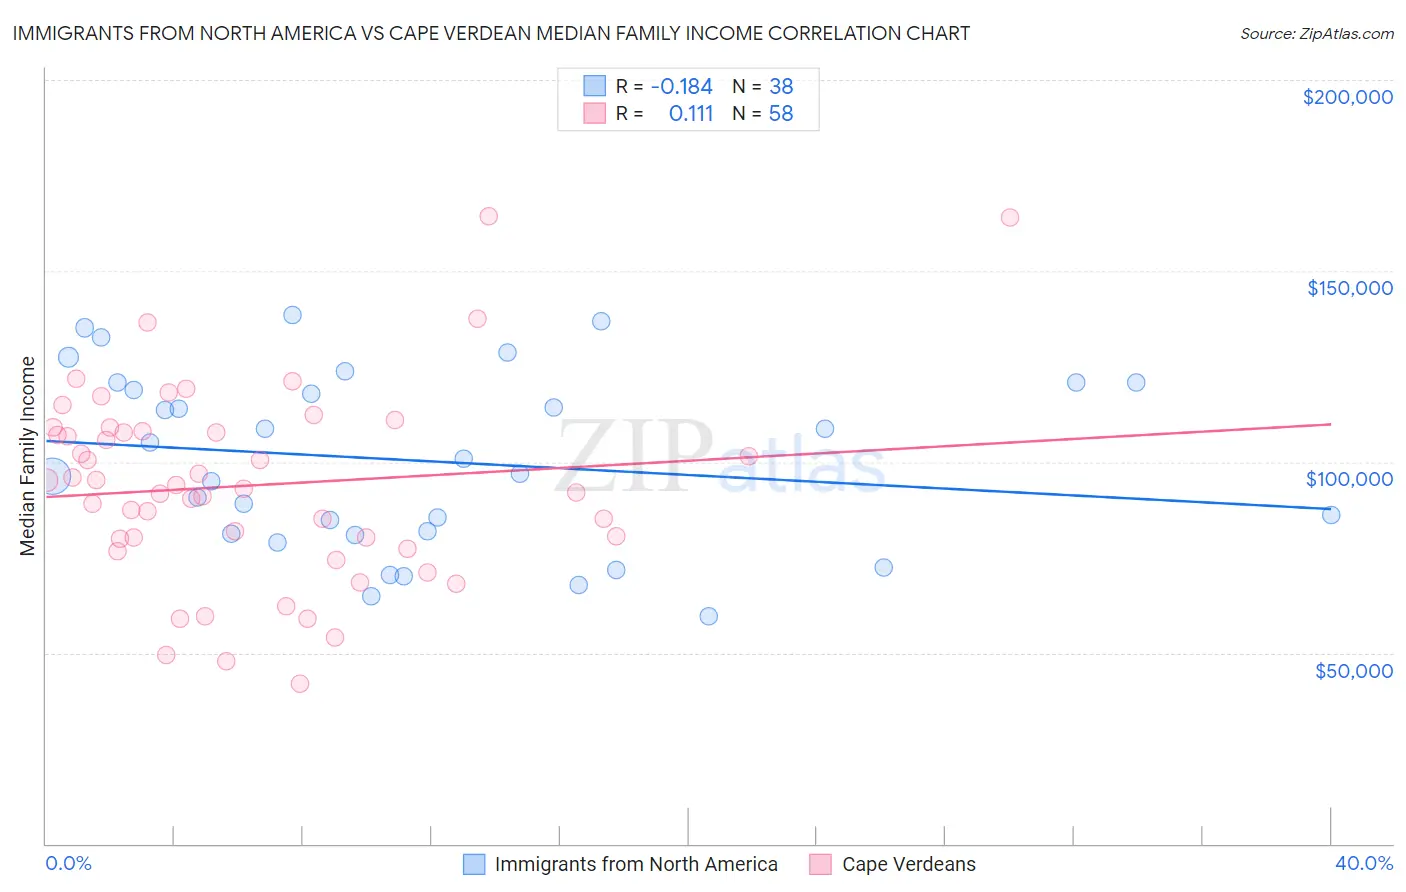
Immigrants from North America vs Cape Verdean Median Family Income Correlation Chart
The statistical analysis conducted on geographies consisting of 462,006,603 people shows a poor negative correlation between the proportion of Immigrants from North America and median family income in the United States with a correlation coefficient (R) of -0.184 and weighted average of $112,151. Similarly, the statistical analysis conducted on geographies consisting of 107,530,088 people shows a poor positive correlation between the proportion of Cape Verdeans and median family income in the United States with a correlation coefficient (R) of 0.111 and weighted average of $91,848, a difference of 22.1%.
Median Family Income Correlation Summary
| Measurement | Immigrants from North America | Cape Verdean |
| Minimum | $59,444 | $41,875 |
| Maximum | $138,302 | $164,351 |
| Range | $78,858 | $122,476 |
| Mean | $100,295 | $93,845 |
| Median | $98,848 | $93,404 |
| Interquartile 25% (IQ1) | $81,159 | $79,783 |
| Interquartile 75% (IQ3) | $120,703 | $107,913 |
| Interquartile Range (IQR) | $39,544 | $28,129 |
| Standard Deviation (Sample) | $23,025 | $25,352 |
| Standard Deviation (Population) | $22,720 | $25,133 |
Similar Demographics by Median Family Income
Demographics Similar to Immigrants from North America by Median Family Income
In terms of median family income, the demographic groups most similar to Immigrants from North America are Immigrants from England ($112,038, a difference of 0.10%), Immigrants from Croatia ($112,323, a difference of 0.15%), Immigrants from Canada ($112,374, a difference of 0.20%), Italian ($112,372, a difference of 0.20%), and Immigrants from Eastern Europe ($112,527, a difference of 0.33%).
| Demographics | Rating | Rank | Median Family Income |
| Immigrants | Italy | 99.4 /100 | #74 | Exceptional $112,848 |
| Immigrants | Western Europe | 99.4 /100 | #75 | Exceptional $112,688 |
| Argentineans | 99.4 /100 | #76 | Exceptional $112,665 |
| Immigrants | Eastern Europe | 99.4 /100 | #77 | Exceptional $112,527 |
| Immigrants | Canada | 99.3 /100 | #78 | Exceptional $112,374 |
| Italians | 99.3 /100 | #79 | Exceptional $112,372 |
| Immigrants | Croatia | 99.3 /100 | #80 | Exceptional $112,323 |
| Immigrants | North America | 99.2 /100 | #81 | Exceptional $112,151 |
| Immigrants | England | 99.2 /100 | #82 | Exceptional $112,038 |
| Immigrants | Egypt | 99.0 /100 | #83 | Exceptional $111,689 |
| Immigrants | Hungary | 98.8 /100 | #84 | Exceptional $111,378 |
| Croatians | 98.8 /100 | #85 | Exceptional $111,370 |
| Ukrainians | 98.8 /100 | #86 | Exceptional $111,368 |
| Austrians | 98.8 /100 | #87 | Exceptional $111,306 |
| Romanians | 98.8 /100 | #88 | Exceptional $111,243 |
Demographics Similar to Cape Verdeans by Median Family Income
In terms of median family income, the demographic groups most similar to Cape Verdeans are Osage ($91,926, a difference of 0.090%), Pennsylvania German ($91,763, a difference of 0.090%), Inupiat ($91,730, a difference of 0.13%), Liberian ($91,722, a difference of 0.14%), and American ($92,096, a difference of 0.27%).
| Demographics | Rating | Rank | Median Family Income |
| Immigrants | El Salvador | 0.6 /100 | #252 | Tragic $92,545 |
| Immigrants | Guyana | 0.6 /100 | #253 | Tragic $92,513 |
| Immigrants | Barbados | 0.5 /100 | #254 | Tragic $92,419 |
| Immigrants | Laos | 0.5 /100 | #255 | Tragic $92,239 |
| Nicaraguans | 0.5 /100 | #256 | Tragic $92,231 |
| Americans | 0.4 /100 | #257 | Tragic $92,096 |
| Osage | 0.4 /100 | #258 | Tragic $91,926 |
| Cape Verdeans | 0.4 /100 | #259 | Tragic $91,848 |
| Pennsylvania Germans | 0.4 /100 | #260 | Tragic $91,763 |
| Inupiat | 0.4 /100 | #261 | Tragic $91,730 |
| Liberians | 0.4 /100 | #262 | Tragic $91,722 |
| Immigrants | West Indies | 0.3 /100 | #263 | Tragic $91,588 |
| Senegalese | 0.3 /100 | #264 | Tragic $91,475 |
| Hmong | 0.3 /100 | #265 | Tragic $91,296 |
| Central Americans | 0.3 /100 | #266 | Tragic $91,087 |