Brazilian vs Immigrants from Dominican Republic Median Female Earnings
COMPARE
Brazilian
Immigrants from Dominican Republic
Median Female Earnings
Median Female Earnings Comparison
Brazilians
Immigrants from Dominican Republic
$40,483
MEDIAN FEMALE EARNINGS
83.6/ 100
METRIC RATING
145th/ 347
METRIC RANK
$36,857
MEDIAN FEMALE EARNINGS
0.3/ 100
METRIC RATING
272nd/ 347
METRIC RANK
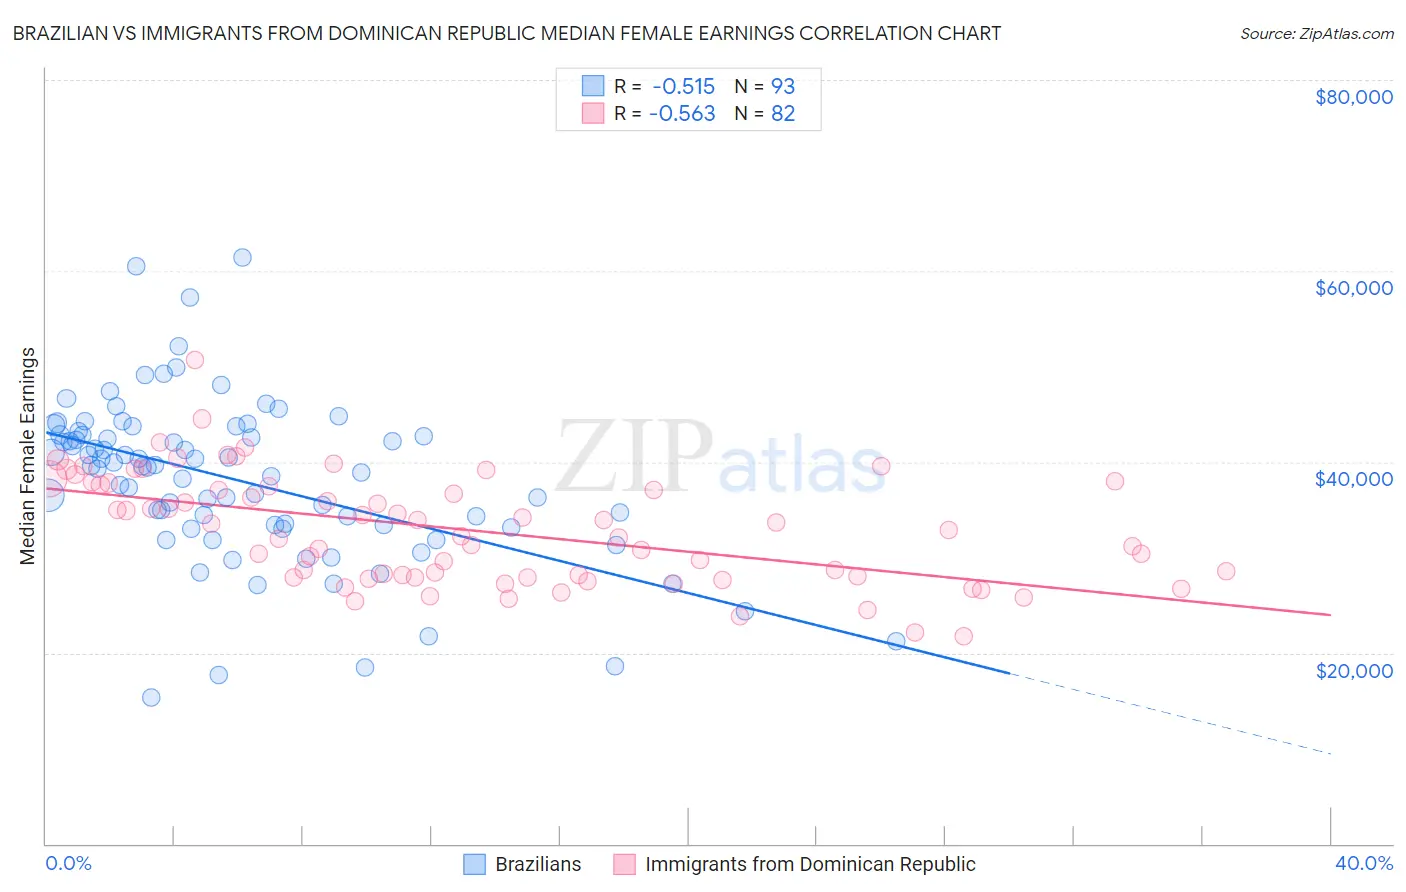
Brazilian vs Immigrants from Dominican Republic Median Female Earnings Correlation Chart
The statistical analysis conducted on geographies consisting of 323,890,405 people shows a substantial negative correlation between the proportion of Brazilians and median female earnings in the United States with a correlation coefficient (R) of -0.515 and weighted average of $40,483. Similarly, the statistical analysis conducted on geographies consisting of 275,036,579 people shows a substantial negative correlation between the proportion of Immigrants from Dominican Republic and median female earnings in the United States with a correlation coefficient (R) of -0.563 and weighted average of $36,857, a difference of 9.8%.
Median Female Earnings Correlation Summary
| Measurement | Brazilian | Immigrants from Dominican Republic |
| Minimum | $15,384 | $21,771 |
| Maximum | $61,398 | $50,664 |
| Range | $46,014 | $28,893 |
| Mean | $38,053 | $32,854 |
| Median | $39,528 | $32,506 |
| Interquartile 25% (IQ1) | $33,268 | $27,940 |
| Interquartile 75% (IQ3) | $42,843 | $37,608 |
| Interquartile Range (IQR) | $9,575 | $9,668 |
| Standard Deviation (Sample) | $8,528 | $5,745 |
| Standard Deviation (Population) | $8,482 | $5,709 |
Similar Demographics by Median Female Earnings
Demographics Similar to Brazilians by Median Female Earnings
In terms of median female earnings, the demographic groups most similar to Brazilians are Immigrants from North Macedonia ($40,488, a difference of 0.010%), Northern European ($40,491, a difference of 0.020%), Sri Lankan ($40,496, a difference of 0.030%), Immigrants from Syria ($40,499, a difference of 0.040%), and Ghanaian ($40,429, a difference of 0.13%).
| Demographics | Rating | Rank | Median Female Earnings |
| Taiwanese | 86.1 /100 | #138 | Excellent $40,576 |
| Immigrants | South Eastern Asia | 85.7 /100 | #139 | Excellent $40,558 |
| Serbians | 85.2 /100 | #140 | Excellent $40,539 |
| Immigrants | Syria | 84.1 /100 | #141 | Excellent $40,499 |
| Sri Lankans | 84.0 /100 | #142 | Excellent $40,496 |
| Northern Europeans | 83.9 /100 | #143 | Excellent $40,491 |
| Immigrants | North Macedonia | 83.8 /100 | #144 | Excellent $40,488 |
| Brazilians | 83.6 /100 | #145 | Excellent $40,483 |
| Ghanaians | 82.1 /100 | #146 | Excellent $40,429 |
| Vietnamese | 80.4 /100 | #147 | Excellent $40,377 |
| Poles | 80.2 /100 | #148 | Excellent $40,371 |
| Immigrants | Cameroon | 79.7 /100 | #149 | Good $40,354 |
| Immigrants | Chile | 79.6 /100 | #150 | Good $40,353 |
| Immigrants | Armenia | 79.2 /100 | #151 | Good $40,340 |
| West Indians | 78.4 /100 | #152 | Good $40,317 |
Demographics Similar to Immigrants from Dominican Republic by Median Female Earnings
In terms of median female earnings, the demographic groups most similar to Immigrants from Dominican Republic are Immigrants from Laos ($36,841, a difference of 0.040%), Nicaraguan ($36,904, a difference of 0.13%), French American Indian ($36,920, a difference of 0.17%), Immigrants from Venezuela ($37,003, a difference of 0.39%), and Cree ($37,018, a difference of 0.44%).
| Demographics | Rating | Rank | Median Female Earnings |
| Immigrants | Belize | 0.4 /100 | #265 | Tragic $37,056 |
| Dominicans | 0.4 /100 | #266 | Tragic $37,046 |
| Immigrants | Nonimmigrants | 0.4 /100 | #267 | Tragic $37,024 |
| Cree | 0.4 /100 | #268 | Tragic $37,018 |
| Immigrants | Venezuela | 0.4 /100 | #269 | Tragic $37,003 |
| French American Indians | 0.3 /100 | #270 | Tragic $36,920 |
| Nicaraguans | 0.3 /100 | #271 | Tragic $36,904 |
| Immigrants | Dominican Republic | 0.3 /100 | #272 | Tragic $36,857 |
| Immigrants | Laos | 0.3 /100 | #273 | Tragic $36,841 |
| Immigrants | El Salvador | 0.2 /100 | #274 | Tragic $36,673 |
| Africans | 0.1 /100 | #275 | Tragic $36,530 |
| Central Americans | 0.1 /100 | #276 | Tragic $36,492 |
| Marshallese | 0.1 /100 | #277 | Tragic $36,459 |
| U.S. Virgin Islanders | 0.1 /100 | #278 | Tragic $36,424 |
| Immigrants | Caribbean | 0.1 /100 | #279 | Tragic $36,414 |