Immigrants from Nigeria vs Senegalese Median Female Earnings
COMPARE
Immigrants from Nigeria
Senegalese
Median Female Earnings
Median Female Earnings Comparison
Immigrants from Nigeria
Senegalese
$39,294
MEDIAN FEMALE EARNINGS
30.2/ 100
METRIC RATING
193rd/ 347
METRIC RANK
$39,384
MEDIAN FEMALE EARNINGS
34.2/ 100
METRIC RATING
189th/ 347
METRIC RANK
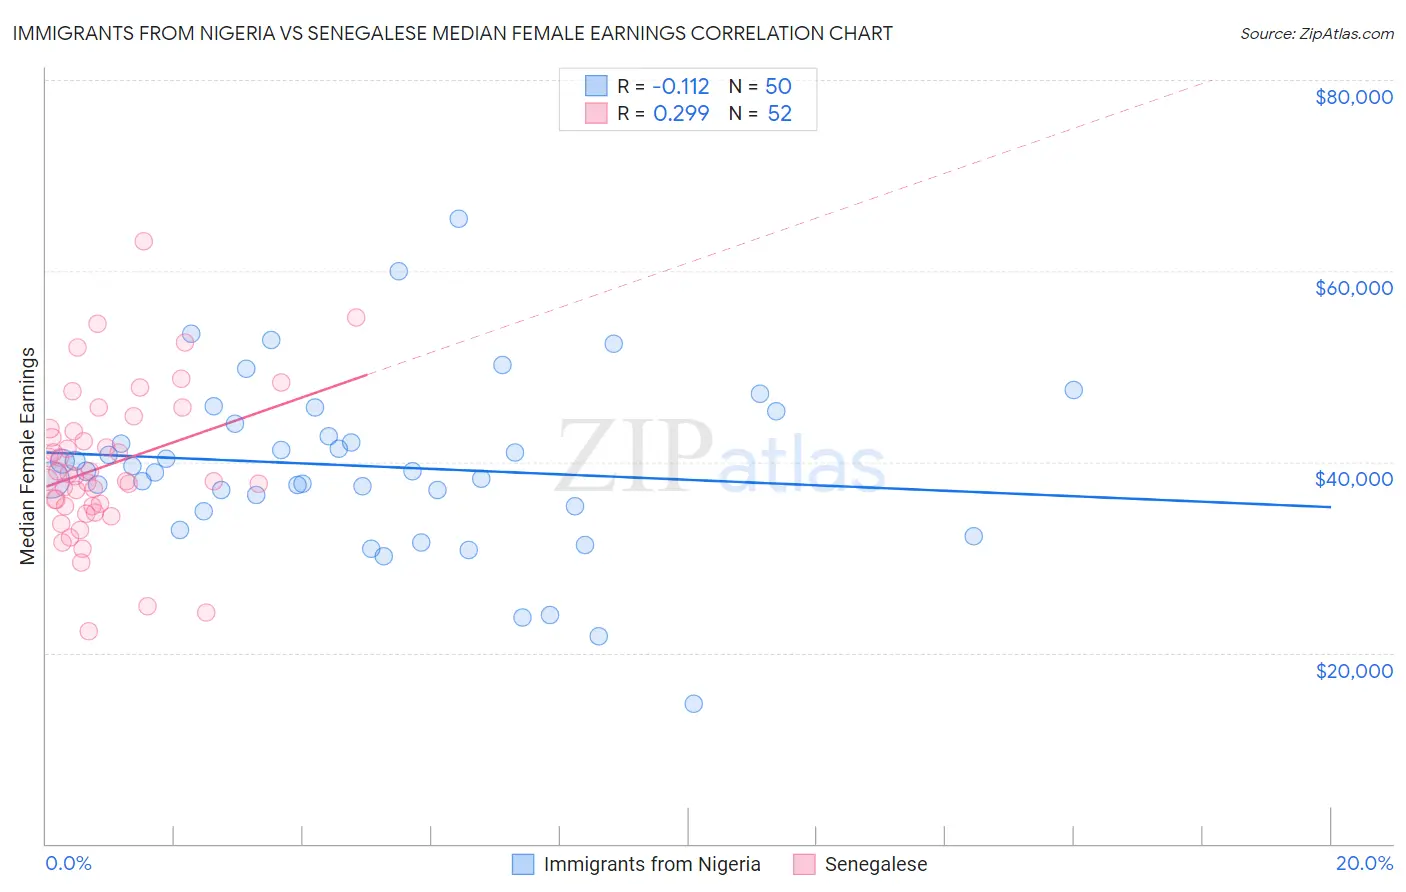
Immigrants from Nigeria vs Senegalese Median Female Earnings Correlation Chart
The statistical analysis conducted on geographies consisting of 283,458,757 people shows a poor negative correlation between the proportion of Immigrants from Nigeria and median female earnings in the United States with a correlation coefficient (R) of -0.112 and weighted average of $39,294. Similarly, the statistical analysis conducted on geographies consisting of 78,104,317 people shows a weak positive correlation between the proportion of Senegalese and median female earnings in the United States with a correlation coefficient (R) of 0.299 and weighted average of $39,384, a difference of 0.23%.
Median Female Earnings Correlation Summary
| Measurement | Immigrants from Nigeria | Senegalese |
| Minimum | $14,696 | $22,259 |
| Maximum | $65,528 | $63,050 |
| Range | $50,832 | $40,791 |
| Mean | $39,545 | $39,635 |
| Median | $39,021 | $38,318 |
| Interquartile 25% (IQ1) | $35,340 | $35,367 |
| Interquartile 75% (IQ3) | $44,001 | $43,341 |
| Interquartile Range (IQR) | $8,661 | $7,973 |
| Standard Deviation (Sample) | $9,154 | $7,802 |
| Standard Deviation (Population) | $9,062 | $7,727 |
Demographics Similar to Immigrants from Nigeria and Senegalese by Median Female Earnings
In terms of median female earnings, the demographic groups most similar to Immigrants from Nigeria are Irish ($39,291, a difference of 0.010%), Immigrants ($39,328, a difference of 0.090%), Immigrants from Western Africa ($39,351, a difference of 0.14%), Uruguayan ($39,228, a difference of 0.17%), and Puget Sound Salish ($39,376, a difference of 0.21%). Similarly, the demographic groups most similar to Senegalese are Puget Sound Salish ($39,376, a difference of 0.020%), Immigrants from Western Africa ($39,351, a difference of 0.080%), Swedish ($39,421, a difference of 0.090%), Bermudan ($39,418, a difference of 0.090%), and Immigrants from West Indies ($39,441, a difference of 0.14%).
| Demographics | Rating | Rank | Median Female Earnings |
| Tsimshian | 41.4 /100 | #181 | Average $39,530 |
| Tlingit-Haida | 40.5 /100 | #182 | Average $39,513 |
| Hungarians | 40.3 /100 | #183 | Average $39,510 |
| Europeans | 37.7 /100 | #184 | Fair $39,457 |
| Immigrants | West Indies | 36.9 /100 | #185 | Fair $39,441 |
| Colombians | 36.9 /100 | #186 | Fair $39,439 |
| Swedes | 36.0 /100 | #187 | Fair $39,421 |
| Bermudans | 35.9 /100 | #188 | Fair $39,418 |
| Senegalese | 34.2 /100 | #189 | Fair $39,384 |
| Puget Sound Salish | 33.9 /100 | #190 | Fair $39,376 |
| Immigrants | Western Africa | 32.7 /100 | #191 | Fair $39,351 |
| Immigrants | Immigrants | 31.7 /100 | #192 | Fair $39,328 |
| Immigrants | Nigeria | 30.2 /100 | #193 | Fair $39,294 |
| Irish | 30.0 /100 | #194 | Fair $39,291 |
| Uruguayans | 27.3 /100 | #195 | Fair $39,228 |
| Immigrants | Costa Rica | 25.6 /100 | #196 | Fair $39,186 |
| Assyrians/Chaldeans/Syriacs | 24.6 /100 | #197 | Fair $39,159 |
| Ecuadorians | 23.0 /100 | #198 | Fair $39,117 |
| Icelanders | 22.7 /100 | #199 | Fair $39,109 |
| Immigrants | Panama | 20.6 /100 | #200 | Fair $39,049 |
| Panamanians | 20.6 /100 | #201 | Fair $39,049 |