Immigrants from Nigeria vs Czech Median Female Earnings
COMPARE
Immigrants from Nigeria
Czech
Median Female Earnings
Median Female Earnings Comparison
Immigrants from Nigeria
Czechs
$39,294
MEDIAN FEMALE EARNINGS
30.2/ 100
METRIC RATING
193rd/ 347
METRIC RANK
$38,992
MEDIAN FEMALE EARNINGS
18.7/ 100
METRIC RATING
203rd/ 347
METRIC RANK
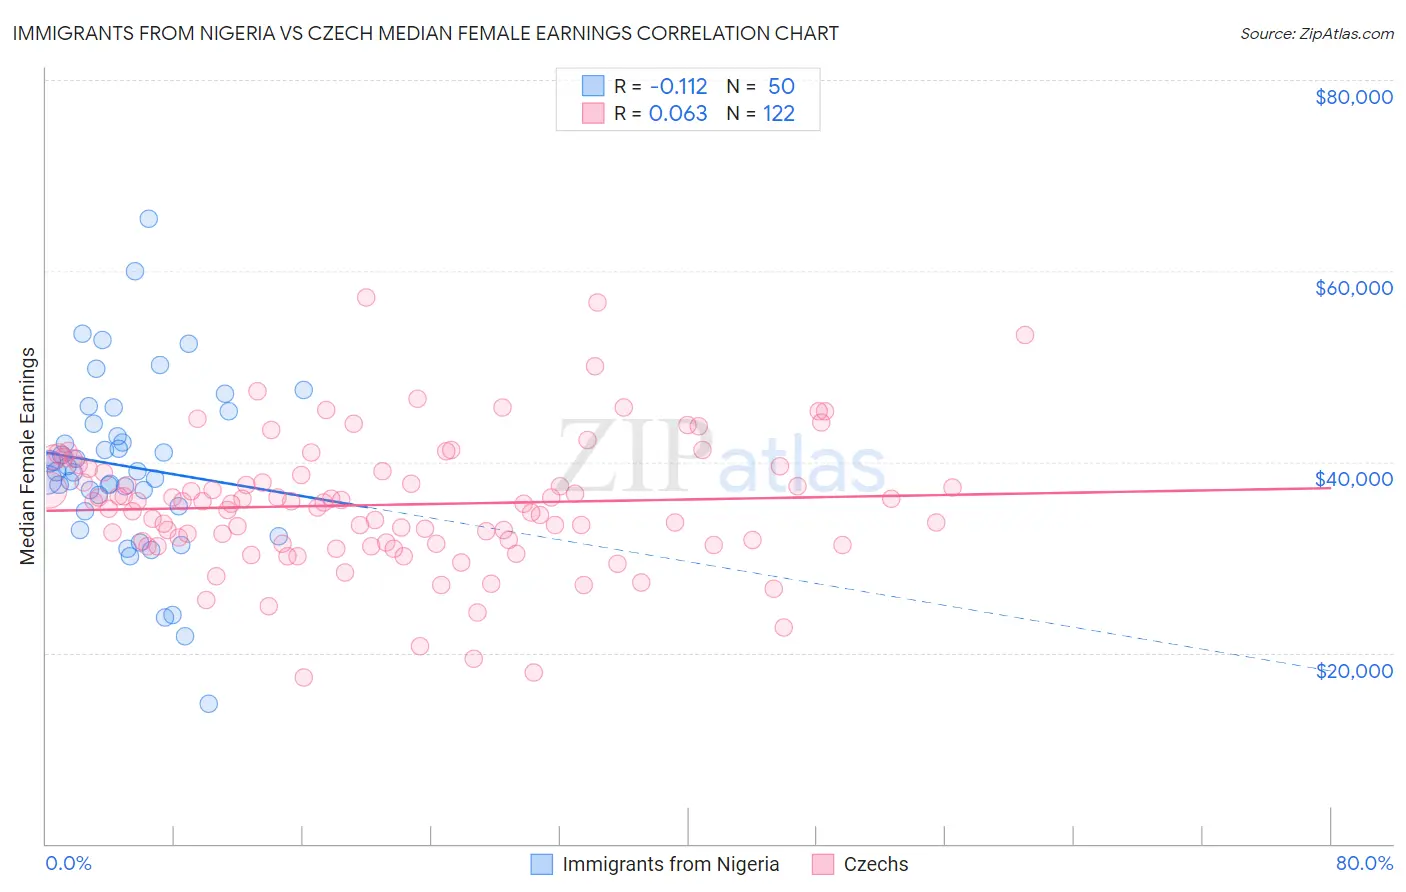
Immigrants from Nigeria vs Czech Median Female Earnings Correlation Chart
The statistical analysis conducted on geographies consisting of 283,458,757 people shows a poor negative correlation between the proportion of Immigrants from Nigeria and median female earnings in the United States with a correlation coefficient (R) of -0.112 and weighted average of $39,294. Similarly, the statistical analysis conducted on geographies consisting of 484,306,761 people shows a slight positive correlation between the proportion of Czechs and median female earnings in the United States with a correlation coefficient (R) of 0.063 and weighted average of $38,992, a difference of 0.78%.
Median Female Earnings Correlation Summary
| Measurement | Immigrants from Nigeria | Czech |
| Minimum | $14,696 | $17,404 |
| Maximum | $65,528 | $57,188 |
| Range | $50,832 | $39,784 |
| Mean | $39,545 | $35,507 |
| Median | $39,021 | $35,690 |
| Interquartile 25% (IQ1) | $35,340 | $31,400 |
| Interquartile 75% (IQ3) | $44,001 | $39,083 |
| Interquartile Range (IQR) | $8,661 | $7,683 |
| Standard Deviation (Sample) | $9,154 | $6,872 |
| Standard Deviation (Population) | $9,062 | $6,843 |
Demographics Similar to Immigrants from Nigeria and Czechs by Median Female Earnings
In terms of median female earnings, the demographic groups most similar to Immigrants from Nigeria are Irish ($39,291, a difference of 0.010%), Immigrants ($39,328, a difference of 0.090%), Immigrants from Western Africa ($39,351, a difference of 0.14%), Uruguayan ($39,228, a difference of 0.17%), and Puget Sound Salish ($39,376, a difference of 0.21%). Similarly, the demographic groups most similar to Czechs are Slovak ($39,029, a difference of 0.090%), Immigrants from Uruguay ($38,945, a difference of 0.12%), Immigrants from Panama ($39,049, a difference of 0.15%), Panamanian ($39,049, a difference of 0.15%), and Immigrants from Colombia ($38,913, a difference of 0.20%).
| Demographics | Rating | Rank | Median Female Earnings |
| Bermudans | 35.9 /100 | #188 | Fair $39,418 |
| Senegalese | 34.2 /100 | #189 | Fair $39,384 |
| Puget Sound Salish | 33.9 /100 | #190 | Fair $39,376 |
| Immigrants | Western Africa | 32.7 /100 | #191 | Fair $39,351 |
| Immigrants | Immigrants | 31.7 /100 | #192 | Fair $39,328 |
| Immigrants | Nigeria | 30.2 /100 | #193 | Fair $39,294 |
| Irish | 30.0 /100 | #194 | Fair $39,291 |
| Uruguayans | 27.3 /100 | #195 | Fair $39,228 |
| Immigrants | Costa Rica | 25.6 /100 | #196 | Fair $39,186 |
| Assyrians/Chaldeans/Syriacs | 24.6 /100 | #197 | Fair $39,159 |
| Ecuadorians | 23.0 /100 | #198 | Fair $39,117 |
| Icelanders | 22.7 /100 | #199 | Fair $39,109 |
| Immigrants | Panama | 20.6 /100 | #200 | Fair $39,049 |
| Panamanians | 20.6 /100 | #201 | Fair $39,049 |
| Slovaks | 19.9 /100 | #202 | Poor $39,029 |
| Czechs | 18.7 /100 | #203 | Poor $38,992 |
| Immigrants | Uruguay | 17.3 /100 | #204 | Poor $38,945 |
| Immigrants | Colombia | 16.3 /100 | #205 | Poor $38,913 |
| Immigrants | Bosnia and Herzegovina | 15.6 /100 | #206 | Poor $38,886 |
| Immigrants | Cambodia | 14.2 /100 | #207 | Poor $38,833 |
| Immigrants | Thailand | 13.6 /100 | #208 | Poor $38,810 |