Immigrants from Laos vs Immigrants from Dominican Republic Median Female Earnings
COMPARE
Immigrants from Laos
Immigrants from Dominican Republic
Median Female Earnings
Median Female Earnings Comparison
Immigrants from Laos
Immigrants from Dominican Republic
$36,841
MEDIAN FEMALE EARNINGS
0.3/ 100
METRIC RATING
273rd/ 347
METRIC RANK
$36,857
MEDIAN FEMALE EARNINGS
0.3/ 100
METRIC RATING
272nd/ 347
METRIC RANK
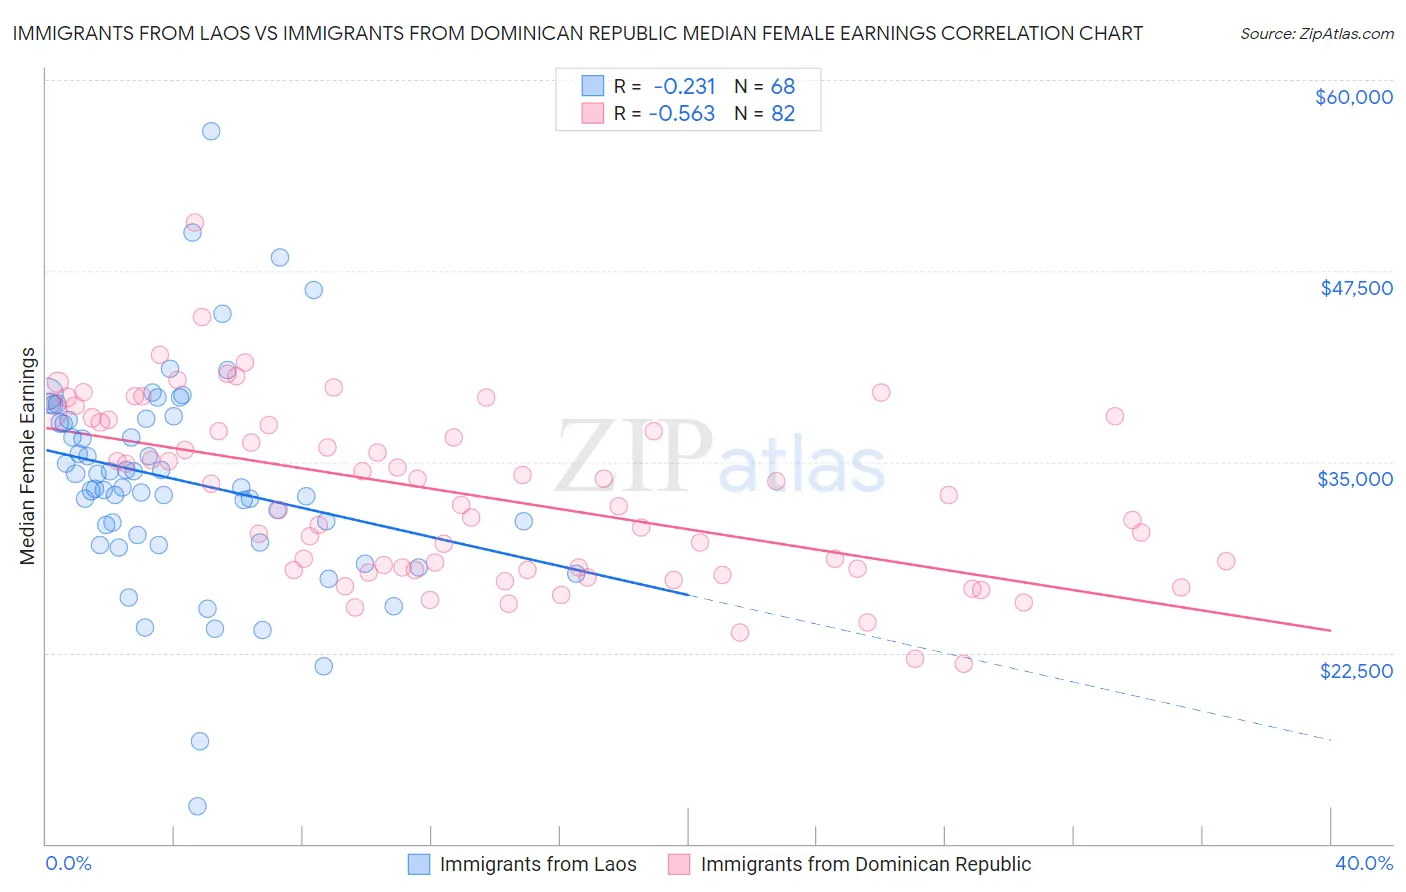
Immigrants from Laos vs Immigrants from Dominican Republic Median Female Earnings Correlation Chart
The statistical analysis conducted on geographies consisting of 201,447,053 people shows a weak negative correlation between the proportion of Immigrants from Laos and median female earnings in the United States with a correlation coefficient (R) of -0.231 and weighted average of $36,841. Similarly, the statistical analysis conducted on geographies consisting of 275,036,579 people shows a substantial negative correlation between the proportion of Immigrants from Dominican Republic and median female earnings in the United States with a correlation coefficient (R) of -0.563 and weighted average of $36,857, a difference of 0.040%.
Median Female Earnings Correlation Summary
| Measurement | Immigrants from Laos | Immigrants from Dominican Republic |
| Minimum | $12,451 | $21,771 |
| Maximum | $56,635 | $50,664 |
| Range | $44,184 | $28,893 |
| Mean | $33,796 | $32,854 |
| Median | $33,308 | $32,506 |
| Interquartile 25% (IQ1) | $29,977 | $27,940 |
| Interquartile 75% (IQ3) | $37,781 | $37,608 |
| Interquartile Range (IQR) | $7,803 | $9,668 |
| Standard Deviation (Sample) | $7,087 | $5,745 |
| Standard Deviation (Population) | $7,035 | $5,709 |
Demographics Similar to Immigrants from Laos and Immigrants from Dominican Republic by Median Female Earnings
In terms of median female earnings, the demographic groups most similar to Immigrants from Laos are Nicaraguan ($36,904, a difference of 0.17%), French American Indian ($36,920, a difference of 0.21%), Immigrants from Venezuela ($37,003, a difference of 0.44%), Immigrants from El Salvador ($36,673, a difference of 0.46%), and Cree ($37,018, a difference of 0.48%). Similarly, the demographic groups most similar to Immigrants from Dominican Republic are Nicaraguan ($36,904, a difference of 0.13%), French American Indian ($36,920, a difference of 0.17%), Immigrants from Venezuela ($37,003, a difference of 0.39%), Cree ($37,018, a difference of 0.44%), and Nonimmigrants ($37,024, a difference of 0.45%).
| Demographics | Rating | Rank | Median Female Earnings |
| Venezuelans | 0.7 /100 | #262 | Tragic $37,282 |
| German Russians | 0.5 /100 | #263 | Tragic $37,105 |
| Salvadorans | 0.4 /100 | #264 | Tragic $37,083 |
| Immigrants | Belize | 0.4 /100 | #265 | Tragic $37,056 |
| Dominicans | 0.4 /100 | #266 | Tragic $37,046 |
| Immigrants | Nonimmigrants | 0.4 /100 | #267 | Tragic $37,024 |
| Cree | 0.4 /100 | #268 | Tragic $37,018 |
| Immigrants | Venezuela | 0.4 /100 | #269 | Tragic $37,003 |
| French American Indians | 0.3 /100 | #270 | Tragic $36,920 |
| Nicaraguans | 0.3 /100 | #271 | Tragic $36,904 |
| Immigrants | Dominican Republic | 0.3 /100 | #272 | Tragic $36,857 |
| Immigrants | Laos | 0.3 /100 | #273 | Tragic $36,841 |
| Immigrants | El Salvador | 0.2 /100 | #274 | Tragic $36,673 |
| Africans | 0.1 /100 | #275 | Tragic $36,530 |
| Central Americans | 0.1 /100 | #276 | Tragic $36,492 |
| Marshallese | 0.1 /100 | #277 | Tragic $36,459 |
| U.S. Virgin Islanders | 0.1 /100 | #278 | Tragic $36,424 |
| Immigrants | Caribbean | 0.1 /100 | #279 | Tragic $36,414 |
| Iroquois | 0.1 /100 | #280 | Tragic $36,408 |
| Spanish Americans | 0.1 /100 | #281 | Tragic $36,391 |
| Haitians | 0.1 /100 | #282 | Tragic $36,374 |