Immigrants from Nicaragua vs Immigrants from Panama Householder Income Ages 45 - 64 years
COMPARE
Immigrants from Nicaragua
Immigrants from Panama
Householder Income Ages 45 - 64 years
Householder Income Ages 45 - 64 years Comparison
Immigrants from Nicaragua
Immigrants from Panama
$89,108
HOUSEHOLDER INCOME AGES 45 - 64 YEARS
0.4/ 100
METRIC RATING
259th/ 347
METRIC RANK
$93,815
HOUSEHOLDER INCOME AGES 45 - 64 YEARS
3.7/ 100
METRIC RATING
228th/ 347
METRIC RANK
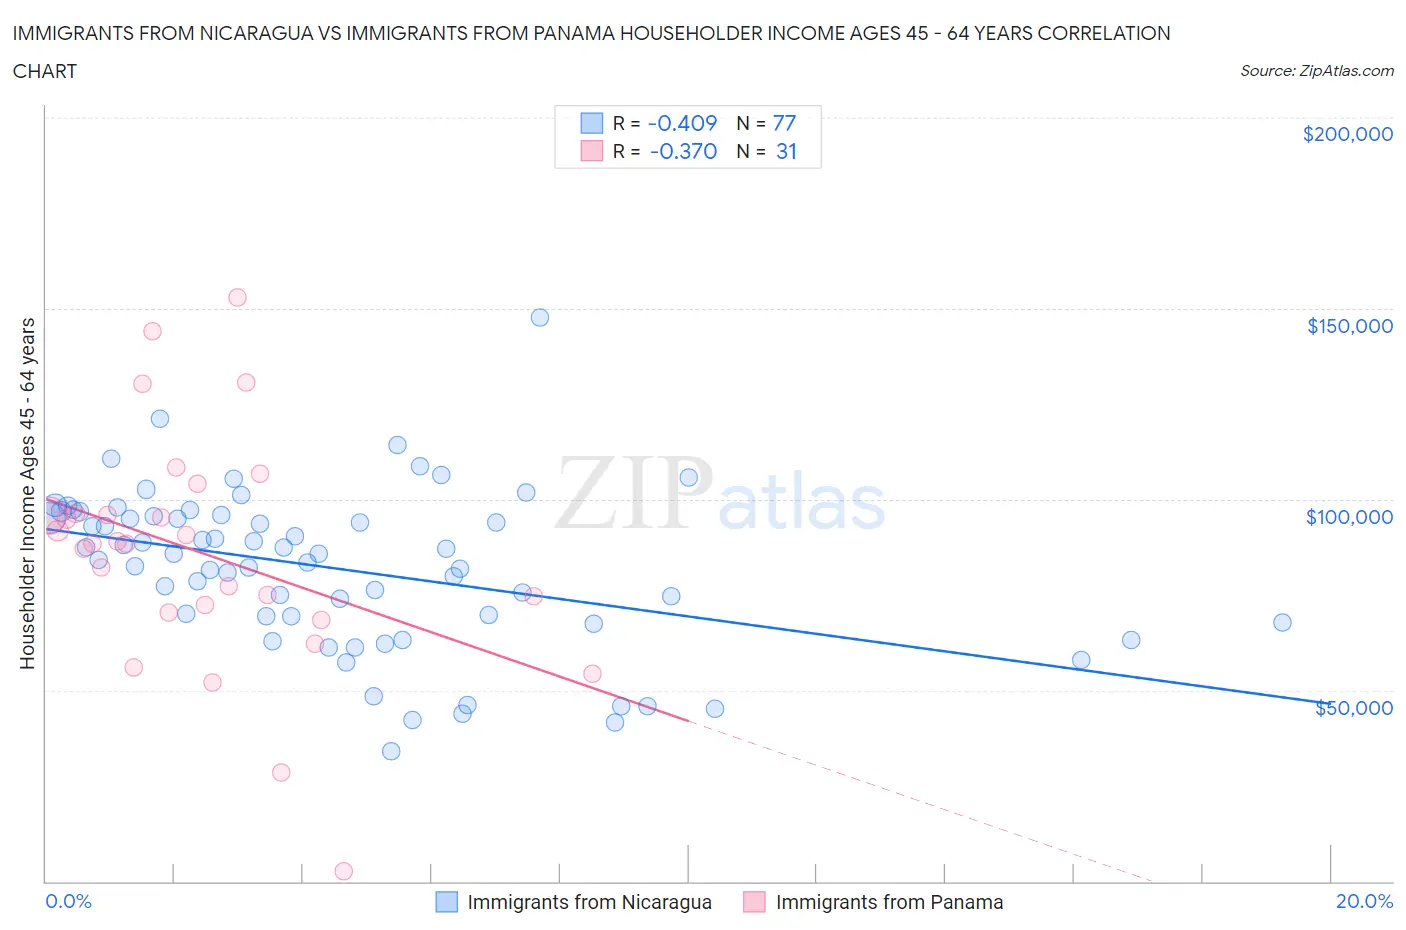
Immigrants from Nicaragua vs Immigrants from Panama Householder Income Ages 45 - 64 years Correlation Chart
The statistical analysis conducted on geographies consisting of 236,224,190 people shows a moderate negative correlation between the proportion of Immigrants from Nicaragua and household income with householder between the ages 45 and 64 in the United States with a correlation coefficient (R) of -0.409 and weighted average of $89,108. Similarly, the statistical analysis conducted on geographies consisting of 221,006,827 people shows a mild negative correlation between the proportion of Immigrants from Panama and household income with householder between the ages 45 and 64 in the United States with a correlation coefficient (R) of -0.370 and weighted average of $93,815, a difference of 5.3%.
Householder Income Ages 45 - 64 years Correlation Summary
| Measurement | Immigrants from Nicaragua | Immigrants from Panama |
| Minimum | $33,906 | $2,499 |
| Maximum | $147,500 | $152,844 |
| Range | $113,594 | $150,345 |
| Mean | $81,875 | $86,009 |
| Median | $85,711 | $88,407 |
| Interquartile 25% (IQ1) | $68,574 | $70,337 |
| Interquartile 75% (IQ3) | $95,783 | $96,322 |
| Interquartile Range (IQR) | $27,209 | $25,984 |
| Standard Deviation (Sample) | $20,905 | $30,853 |
| Standard Deviation (Population) | $20,769 | $30,351 |
Similar Demographics by Householder Income Ages 45 - 64 years
Demographics Similar to Immigrants from Nicaragua by Householder Income Ages 45 - 64 years
In terms of householder income ages 45 - 64 years, the demographic groups most similar to Immigrants from Nicaragua are Liberian ($88,929, a difference of 0.20%), Immigrants from Barbados ($89,394, a difference of 0.32%), German Russian ($89,398, a difference of 0.33%), Belizean ($88,684, a difference of 0.48%), and Somali ($88,600, a difference of 0.57%).
| Demographics | Rating | Rank | Householder Income Ages 45 - 64 years |
| Marshallese | 0.7 /100 | #252 | Tragic $90,455 |
| Barbadians | 0.6 /100 | #253 | Tragic $90,266 |
| Immigrants | Guyana | 0.6 /100 | #254 | Tragic $90,186 |
| West Indians | 0.5 /100 | #255 | Tragic $89,906 |
| French American Indians | 0.5 /100 | #256 | Tragic $89,811 |
| German Russians | 0.4 /100 | #257 | Tragic $89,398 |
| Immigrants | Barbados | 0.4 /100 | #258 | Tragic $89,394 |
| Immigrants | Nicaragua | 0.4 /100 | #259 | Tragic $89,108 |
| Liberians | 0.3 /100 | #260 | Tragic $88,929 |
| Belizeans | 0.3 /100 | #261 | Tragic $88,684 |
| Somalis | 0.3 /100 | #262 | Tragic $88,600 |
| Immigrants | Senegal | 0.3 /100 | #263 | Tragic $88,421 |
| Osage | 0.3 /100 | #264 | Tragic $88,390 |
| Jamaicans | 0.2 /100 | #265 | Tragic $88,327 |
| Immigrants | West Indies | 0.2 /100 | #266 | Tragic $88,164 |
Demographics Similar to Immigrants from Panama by Householder Income Ages 45 - 64 years
In terms of householder income ages 45 - 64 years, the demographic groups most similar to Immigrants from Panama are Vietnamese ($93,788, a difference of 0.030%), Immigrants from Sudan ($93,781, a difference of 0.040%), Ecuadorian ($93,739, a difference of 0.080%), Sudanese ($93,718, a difference of 0.10%), and Alaska Native ($93,991, a difference of 0.19%).
| Demographics | Rating | Rank | Householder Income Ages 45 - 64 years |
| Immigrants | Nigeria | 5.9 /100 | #221 | Tragic $94,804 |
| Malaysians | 5.2 /100 | #222 | Tragic $94,517 |
| Immigrants | Nonimmigrants | 5.0 /100 | #223 | Tragic $94,448 |
| Immigrants | Bosnia and Herzegovina | 4.6 /100 | #224 | Tragic $94,288 |
| Bermudans | 4.4 /100 | #225 | Tragic $94,197 |
| Immigrants | Azores | 4.3 /100 | #226 | Tragic $94,138 |
| Alaska Natives | 4.0 /100 | #227 | Tragic $93,991 |
| Immigrants | Panama | 3.7 /100 | #228 | Tragic $93,815 |
| Vietnamese | 3.6 /100 | #229 | Tragic $93,788 |
| Immigrants | Sudan | 3.6 /100 | #230 | Tragic $93,781 |
| Ecuadorians | 3.6 /100 | #231 | Tragic $93,739 |
| Sudanese | 3.5 /100 | #232 | Tragic $93,718 |
| Nepalese | 3.0 /100 | #233 | Tragic $93,355 |
| Immigrants | El Salvador | 2.7 /100 | #234 | Tragic $93,176 |
| Nicaraguans | 2.0 /100 | #235 | Tragic $92,554 |