Immigrants from Nicaragua vs Immigrants from Panama Child Poverty Among Boys Under 16
COMPARE
Immigrants from Nicaragua
Immigrants from Panama
Child Poverty Among Boys Under 16
Child Poverty Among Boys Under 16 Comparison
Immigrants from Nicaragua
Immigrants from Panama
19.0%
CHILD POVERTY AMONG BOYS UNDER 16
0.4/ 100
METRIC RATING
246th/ 347
METRIC RANK
17.9%
CHILD POVERTY AMONG BOYS UNDER 16
4.3/ 100
METRIC RATING
221st/ 347
METRIC RANK
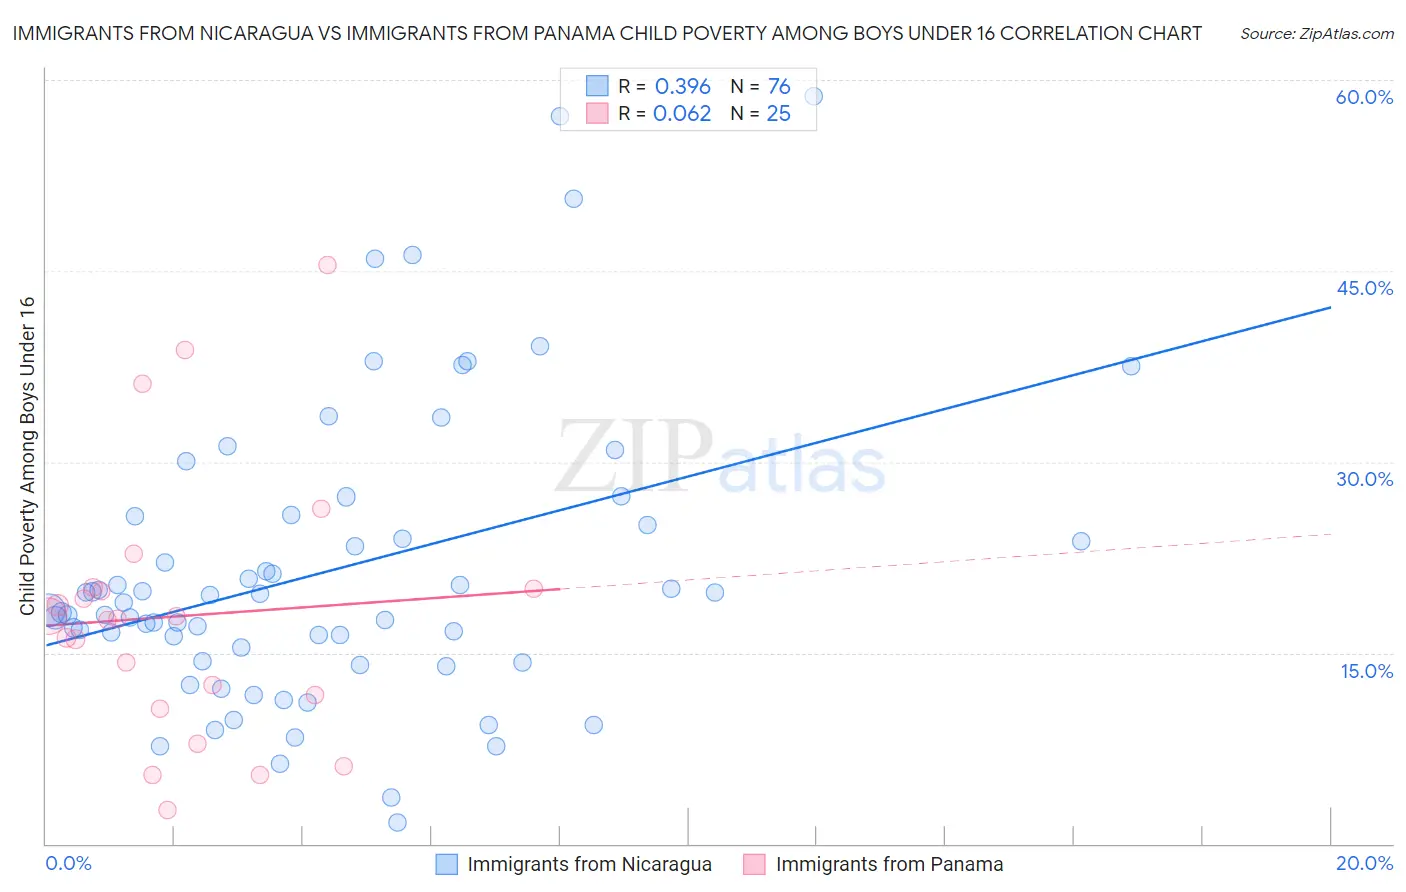
Immigrants from Nicaragua vs Immigrants from Panama Child Poverty Among Boys Under 16 Correlation Chart
The statistical analysis conducted on geographies consisting of 235,106,184 people shows a mild positive correlation between the proportion of Immigrants from Nicaragua and poverty level among boys under the age of 16 in the United States with a correlation coefficient (R) of 0.396 and weighted average of 19.0%. Similarly, the statistical analysis conducted on geographies consisting of 219,900,971 people shows a slight positive correlation between the proportion of Immigrants from Panama and poverty level among boys under the age of 16 in the United States with a correlation coefficient (R) of 0.062 and weighted average of 17.9%, a difference of 6.4%.
Child Poverty Among Boys Under 16 Correlation Summary
| Measurement | Immigrants from Nicaragua | Immigrants from Panama |
| Minimum | 1.7% | 2.7% |
| Maximum | 58.8% | 45.5% |
| Range | 57.0% | 42.8% |
| Mean | 21.4% | 17.9% |
| Median | 18.6% | 17.7% |
| Interquartile 25% (IQ1) | 14.9% | 11.1% |
| Interquartile 75% (IQ3) | 25.4% | 20.1% |
| Interquartile Range (IQR) | 10.5% | 8.9% |
| Standard Deviation (Sample) | 11.5% | 10.3% |
| Standard Deviation (Population) | 11.4% | 10.1% |
Similar Demographics by Child Poverty Among Boys Under 16
Demographics Similar to Immigrants from Nicaragua by Child Poverty Among Boys Under 16
In terms of child poverty among boys under 16, the demographic groups most similar to Immigrants from Nicaragua are Immigrants from Trinidad and Tobago (19.0%, a difference of 0.12%), Cree (19.0%, a difference of 0.20%), Salvadoran (19.0%, a difference of 0.20%), Immigrants from Middle Africa (18.9%, a difference of 0.33%), and Immigrants from the Azores (18.9%, a difference of 0.34%).
| Demographics | Rating | Rank | Child Poverty Among Boys Under 16 |
| Cape Verdeans | 0.7 /100 | #239 | Tragic 18.7% |
| Immigrants | Cuba | 0.6 /100 | #240 | Tragic 18.8% |
| Immigrants | Sudan | 0.6 /100 | #241 | Tragic 18.8% |
| Ghanaians | 0.5 /100 | #242 | Tragic 18.9% |
| Immigrants | Azores | 0.4 /100 | #243 | Tragic 18.9% |
| Immigrants | Middle Africa | 0.4 /100 | #244 | Tragic 18.9% |
| Cree | 0.4 /100 | #245 | Tragic 19.0% |
| Immigrants | Nicaragua | 0.4 /100 | #246 | Tragic 19.0% |
| Immigrants | Trinidad and Tobago | 0.3 /100 | #247 | Tragic 19.0% |
| Salvadorans | 0.3 /100 | #248 | Tragic 19.0% |
| Alsatians | 0.3 /100 | #249 | Tragic 19.1% |
| Immigrants | Burma/Myanmar | 0.2 /100 | #250 | Tragic 19.2% |
| French American Indians | 0.2 /100 | #251 | Tragic 19.2% |
| Immigrants | Western Africa | 0.2 /100 | #252 | Tragic 19.3% |
| Liberians | 0.2 /100 | #253 | Tragic 19.3% |
Demographics Similar to Immigrants from Panama by Child Poverty Among Boys Under 16
In terms of child poverty among boys under 16, the demographic groups most similar to Immigrants from Panama are Pennsylvania German (17.9%, a difference of 0.23%), Cuban (17.9%, a difference of 0.32%), Immigrants from Cambodia (17.8%, a difference of 0.47%), Sierra Leonean (17.8%, a difference of 0.60%), and Iraqi (17.7%, a difference of 0.68%).
| Demographics | Rating | Rank | Child Poverty Among Boys Under 16 |
| Panamanians | 5.9 /100 | #214 | Tragic 17.7% |
| Osage | 5.8 /100 | #215 | Tragic 17.7% |
| Moroccans | 5.6 /100 | #216 | Tragic 17.7% |
| Japanese | 5.5 /100 | #217 | Tragic 17.7% |
| Iraqis | 5.5 /100 | #218 | Tragic 17.7% |
| Sierra Leoneans | 5.3 /100 | #219 | Tragic 17.8% |
| Immigrants | Cambodia | 5.1 /100 | #220 | Tragic 17.8% |
| Immigrants | Panama | 4.3 /100 | #221 | Tragic 17.9% |
| Pennsylvania Germans | 3.9 /100 | #222 | Tragic 17.9% |
| Cubans | 3.8 /100 | #223 | Tragic 17.9% |
| Nepalese | 3.2 /100 | #224 | Tragic 18.0% |
| Inupiat | 2.7 /100 | #225 | Tragic 18.1% |
| Immigrants | Africa | 2.6 /100 | #226 | Tragic 18.1% |
| Bermudans | 2.5 /100 | #227 | Tragic 18.1% |
| Immigrants | Nonimmigrants | 2.2 /100 | #228 | Tragic 18.2% |