Immigrants from Nicaragua vs Osage Householder Income Ages 45 - 64 years
COMPARE
Immigrants from Nicaragua
Osage
Householder Income Ages 45 - 64 years
Householder Income Ages 45 - 64 years Comparison
Immigrants from Nicaragua
Osage
$89,108
HOUSEHOLDER INCOME AGES 45 - 64 YEARS
0.4/ 100
METRIC RATING
259th/ 347
METRIC RANK
$88,390
HOUSEHOLDER INCOME AGES 45 - 64 YEARS
0.3/ 100
METRIC RATING
264th/ 347
METRIC RANK
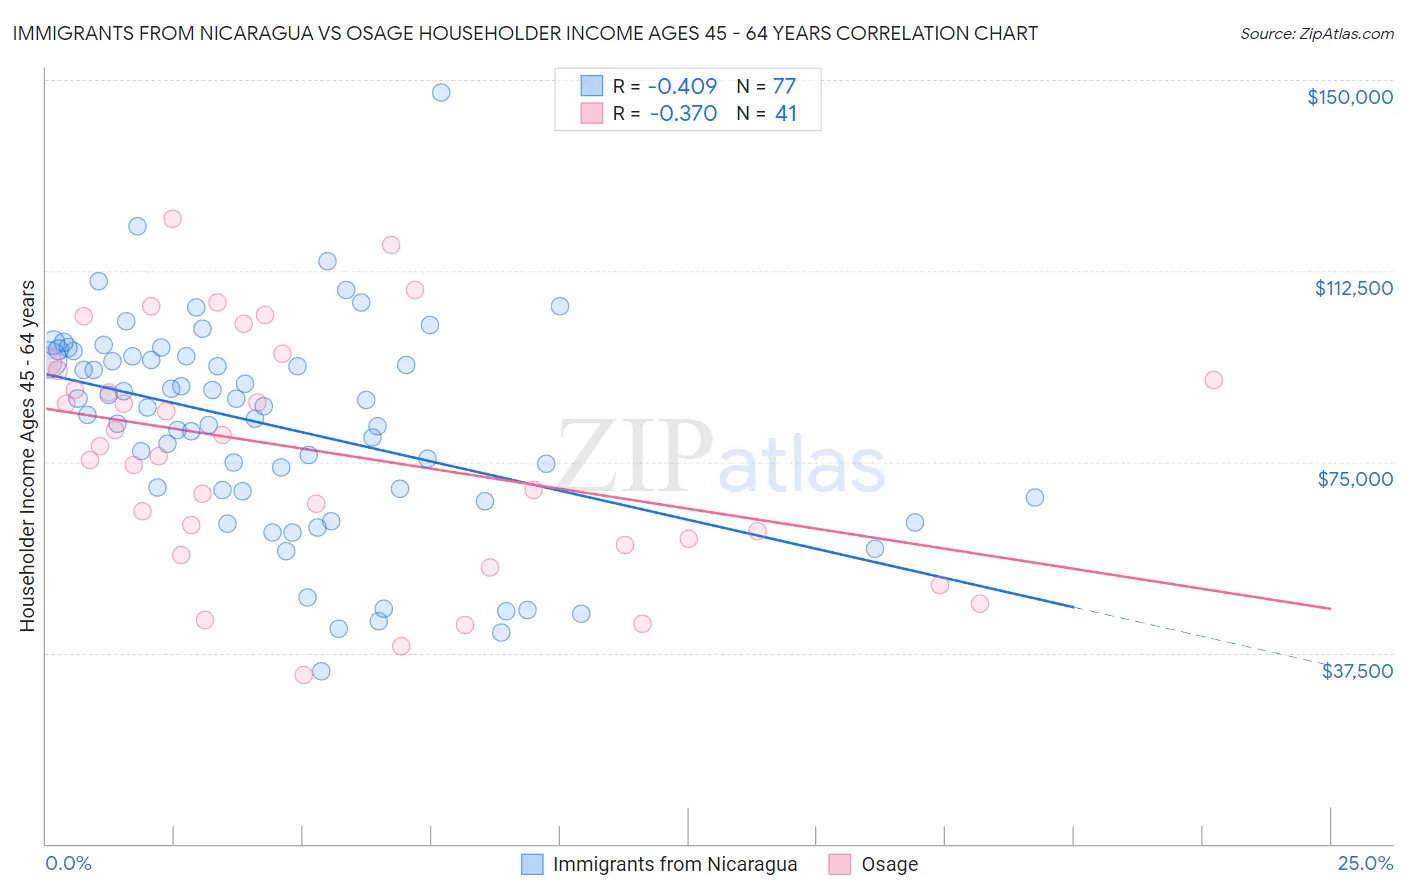
Immigrants from Nicaragua vs Osage Householder Income Ages 45 - 64 years Correlation Chart
The statistical analysis conducted on geographies consisting of 236,224,190 people shows a moderate negative correlation between the proportion of Immigrants from Nicaragua and household income with householder between the ages 45 and 64 in the United States with a correlation coefficient (R) of -0.409 and weighted average of $89,108. Similarly, the statistical analysis conducted on geographies consisting of 91,774,888 people shows a mild negative correlation between the proportion of Osage and household income with householder between the ages 45 and 64 in the United States with a correlation coefficient (R) of -0.370 and weighted average of $88,390, a difference of 0.81%.
Householder Income Ages 45 - 64 years Correlation Summary
| Measurement | Immigrants from Nicaragua | Osage |
| Minimum | $33,906 | $33,125 |
| Maximum | $147,500 | $122,824 |
| Range | $113,594 | $89,699 |
| Mean | $81,875 | $76,991 |
| Median | $85,711 | $78,120 |
| Interquartile 25% (IQ1) | $68,574 | $59,314 |
| Interquartile 75% (IQ3) | $95,783 | $93,781 |
| Interquartile Range (IQR) | $27,209 | $34,467 |
| Standard Deviation (Sample) | $20,905 | $22,918 |
| Standard Deviation (Population) | $20,769 | $22,637 |
Demographics Similar to Immigrants from Nicaragua and Osage by Householder Income Ages 45 - 64 years
In terms of householder income ages 45 - 64 years, the demographic groups most similar to Immigrants from Nicaragua are Liberian ($88,929, a difference of 0.20%), Immigrants from Barbados ($89,394, a difference of 0.32%), German Russian ($89,398, a difference of 0.33%), Belizean ($88,684, a difference of 0.48%), and Somali ($88,600, a difference of 0.57%). Similarly, the demographic groups most similar to Osage are Immigrants from Senegal ($88,421, a difference of 0.040%), Jamaican ($88,327, a difference of 0.070%), Somali ($88,600, a difference of 0.24%), Immigrants from West Indies ($88,164, a difference of 0.26%), and Hmong ($88,115, a difference of 0.31%).
| Demographics | Rating | Rank | Householder Income Ages 45 - 64 years |
| Americans | 0.7 /100 | #251 | Tragic $90,536 |
| Marshallese | 0.7 /100 | #252 | Tragic $90,455 |
| Barbadians | 0.6 /100 | #253 | Tragic $90,266 |
| Immigrants | Guyana | 0.6 /100 | #254 | Tragic $90,186 |
| West Indians | 0.5 /100 | #255 | Tragic $89,906 |
| French American Indians | 0.5 /100 | #256 | Tragic $89,811 |
| German Russians | 0.4 /100 | #257 | Tragic $89,398 |
| Immigrants | Barbados | 0.4 /100 | #258 | Tragic $89,394 |
| Immigrants | Nicaragua | 0.4 /100 | #259 | Tragic $89,108 |
| Liberians | 0.3 /100 | #260 | Tragic $88,929 |
| Belizeans | 0.3 /100 | #261 | Tragic $88,684 |
| Somalis | 0.3 /100 | #262 | Tragic $88,600 |
| Immigrants | Senegal | 0.3 /100 | #263 | Tragic $88,421 |
| Osage | 0.3 /100 | #264 | Tragic $88,390 |
| Jamaicans | 0.2 /100 | #265 | Tragic $88,327 |
| Immigrants | West Indies | 0.2 /100 | #266 | Tragic $88,164 |
| Hmong | 0.2 /100 | #267 | Tragic $88,115 |
| Immigrants | Micronesia | 0.2 /100 | #268 | Tragic $87,864 |
| Spanish Americans | 0.2 /100 | #269 | Tragic $87,836 |
| Immigrants | Liberia | 0.2 /100 | #270 | Tragic $87,739 |
| Guatemalans | 0.2 /100 | #271 | Tragic $87,705 |