Immigrants from Nicaragua vs Immigrants from Mexico Householder Income Ages 45 - 64 years
COMPARE
Immigrants from Nicaragua
Immigrants from Mexico
Householder Income Ages 45 - 64 years
Householder Income Ages 45 - 64 years Comparison
Immigrants from Nicaragua
Immigrants from Mexico
$89,108
HOUSEHOLDER INCOME AGES 45 - 64 YEARS
0.4/ 100
METRIC RATING
259th/ 347
METRIC RANK
$84,910
HOUSEHOLDER INCOME AGES 45 - 64 YEARS
0.0/ 100
METRIC RATING
299th/ 347
METRIC RANK
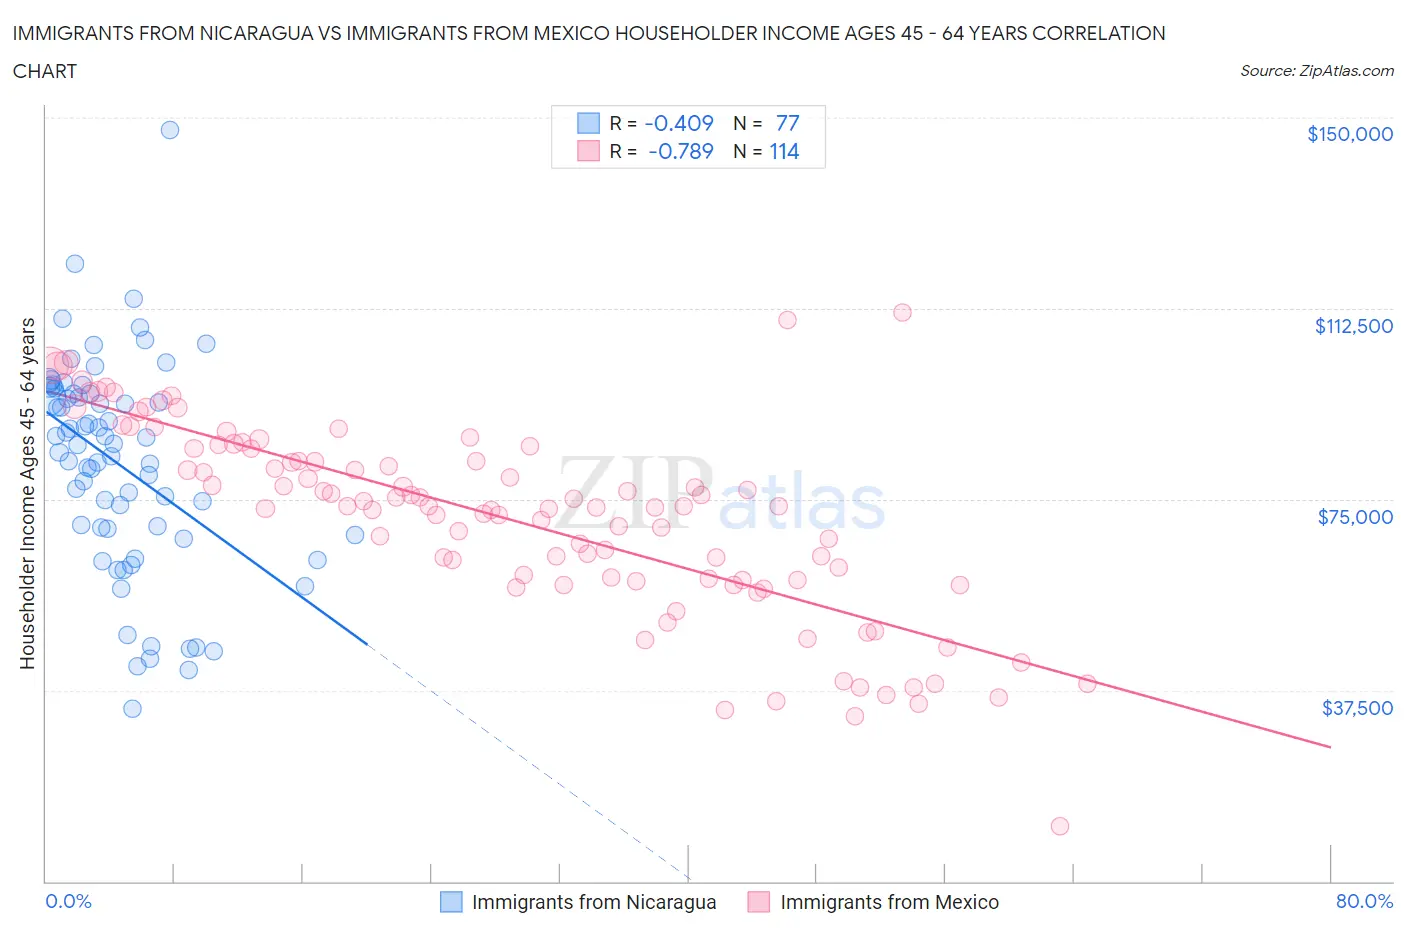
Immigrants from Nicaragua vs Immigrants from Mexico Householder Income Ages 45 - 64 years Correlation Chart
The statistical analysis conducted on geographies consisting of 236,224,190 people shows a moderate negative correlation between the proportion of Immigrants from Nicaragua and household income with householder between the ages 45 and 64 in the United States with a correlation coefficient (R) of -0.409 and weighted average of $89,108. Similarly, the statistical analysis conducted on geographies consisting of 511,517,023 people shows a strong negative correlation between the proportion of Immigrants from Mexico and household income with householder between the ages 45 and 64 in the United States with a correlation coefficient (R) of -0.789 and weighted average of $84,910, a difference of 4.9%.
Householder Income Ages 45 - 64 years Correlation Summary
| Measurement | Immigrants from Nicaragua | Immigrants from Mexico |
| Minimum | $33,906 | $10,788 |
| Maximum | $147,500 | $111,667 |
| Range | $113,594 | $100,879 |
| Mean | $81,875 | $71,096 |
| Median | $85,711 | $73,588 |
| Interquartile 25% (IQ1) | $68,574 | $59,284 |
| Interquartile 75% (IQ3) | $95,783 | $85,004 |
| Interquartile Range (IQR) | $27,209 | $25,720 |
| Standard Deviation (Sample) | $20,905 | $18,984 |
| Standard Deviation (Population) | $20,769 | $18,900 |
Similar Demographics by Householder Income Ages 45 - 64 years
Demographics Similar to Immigrants from Nicaragua by Householder Income Ages 45 - 64 years
In terms of householder income ages 45 - 64 years, the demographic groups most similar to Immigrants from Nicaragua are Liberian ($88,929, a difference of 0.20%), Immigrants from Barbados ($89,394, a difference of 0.32%), German Russian ($89,398, a difference of 0.33%), Belizean ($88,684, a difference of 0.48%), and Somali ($88,600, a difference of 0.57%).
| Demographics | Rating | Rank | Householder Income Ages 45 - 64 years |
| Marshallese | 0.7 /100 | #252 | Tragic $90,455 |
| Barbadians | 0.6 /100 | #253 | Tragic $90,266 |
| Immigrants | Guyana | 0.6 /100 | #254 | Tragic $90,186 |
| West Indians | 0.5 /100 | #255 | Tragic $89,906 |
| French American Indians | 0.5 /100 | #256 | Tragic $89,811 |
| German Russians | 0.4 /100 | #257 | Tragic $89,398 |
| Immigrants | Barbados | 0.4 /100 | #258 | Tragic $89,394 |
| Immigrants | Nicaragua | 0.4 /100 | #259 | Tragic $89,108 |
| Liberians | 0.3 /100 | #260 | Tragic $88,929 |
| Belizeans | 0.3 /100 | #261 | Tragic $88,684 |
| Somalis | 0.3 /100 | #262 | Tragic $88,600 |
| Immigrants | Senegal | 0.3 /100 | #263 | Tragic $88,421 |
| Osage | 0.3 /100 | #264 | Tragic $88,390 |
| Jamaicans | 0.2 /100 | #265 | Tragic $88,327 |
| Immigrants | West Indies | 0.2 /100 | #266 | Tragic $88,164 |
Demographics Similar to Immigrants from Mexico by Householder Income Ages 45 - 64 years
In terms of householder income ages 45 - 64 years, the demographic groups most similar to Immigrants from Mexico are African ($84,925, a difference of 0.020%), Indonesian ($84,890, a difference of 0.020%), Fijian ($85,187, a difference of 0.33%), Immigrants from Zaire ($85,207, a difference of 0.35%), and Potawatomi ($84,613, a difference of 0.35%).
| Demographics | Rating | Rank | Householder Income Ages 45 - 64 years |
| Immigrants | Central America | 0.1 /100 | #292 | Tragic $85,965 |
| Comanche | 0.1 /100 | #293 | Tragic $85,787 |
| British West Indians | 0.1 /100 | #294 | Tragic $85,571 |
| Immigrants | Grenada | 0.1 /100 | #295 | Tragic $85,552 |
| Immigrants | Zaire | 0.1 /100 | #296 | Tragic $85,207 |
| Fijians | 0.1 /100 | #297 | Tragic $85,187 |
| Africans | 0.0 /100 | #298 | Tragic $84,925 |
| Immigrants | Mexico | 0.0 /100 | #299 | Tragic $84,910 |
| Indonesians | 0.0 /100 | #300 | Tragic $84,890 |
| Potawatomi | 0.0 /100 | #301 | Tragic $84,613 |
| Haitians | 0.0 /100 | #302 | Tragic $84,384 |
| Hondurans | 0.0 /100 | #303 | Tragic $84,079 |
| Ottawa | 0.0 /100 | #304 | Tragic $83,953 |
| Chippewa | 0.0 /100 | #305 | Tragic $83,943 |
| Ute | 0.0 /100 | #306 | Tragic $83,937 |