Immigrants from Nicaragua vs Cambodian Householder Income Ages 45 - 64 years
COMPARE
Immigrants from Nicaragua
Cambodian
Householder Income Ages 45 - 64 years
Householder Income Ages 45 - 64 years Comparison
Immigrants from Nicaragua
Cambodians
$89,108
HOUSEHOLDER INCOME AGES 45 - 64 YEARS
0.4/ 100
METRIC RATING
259th/ 347
METRIC RANK
$114,342
HOUSEHOLDER INCOME AGES 45 - 64 YEARS
99.9/ 100
METRIC RATING
40th/ 347
METRIC RANK
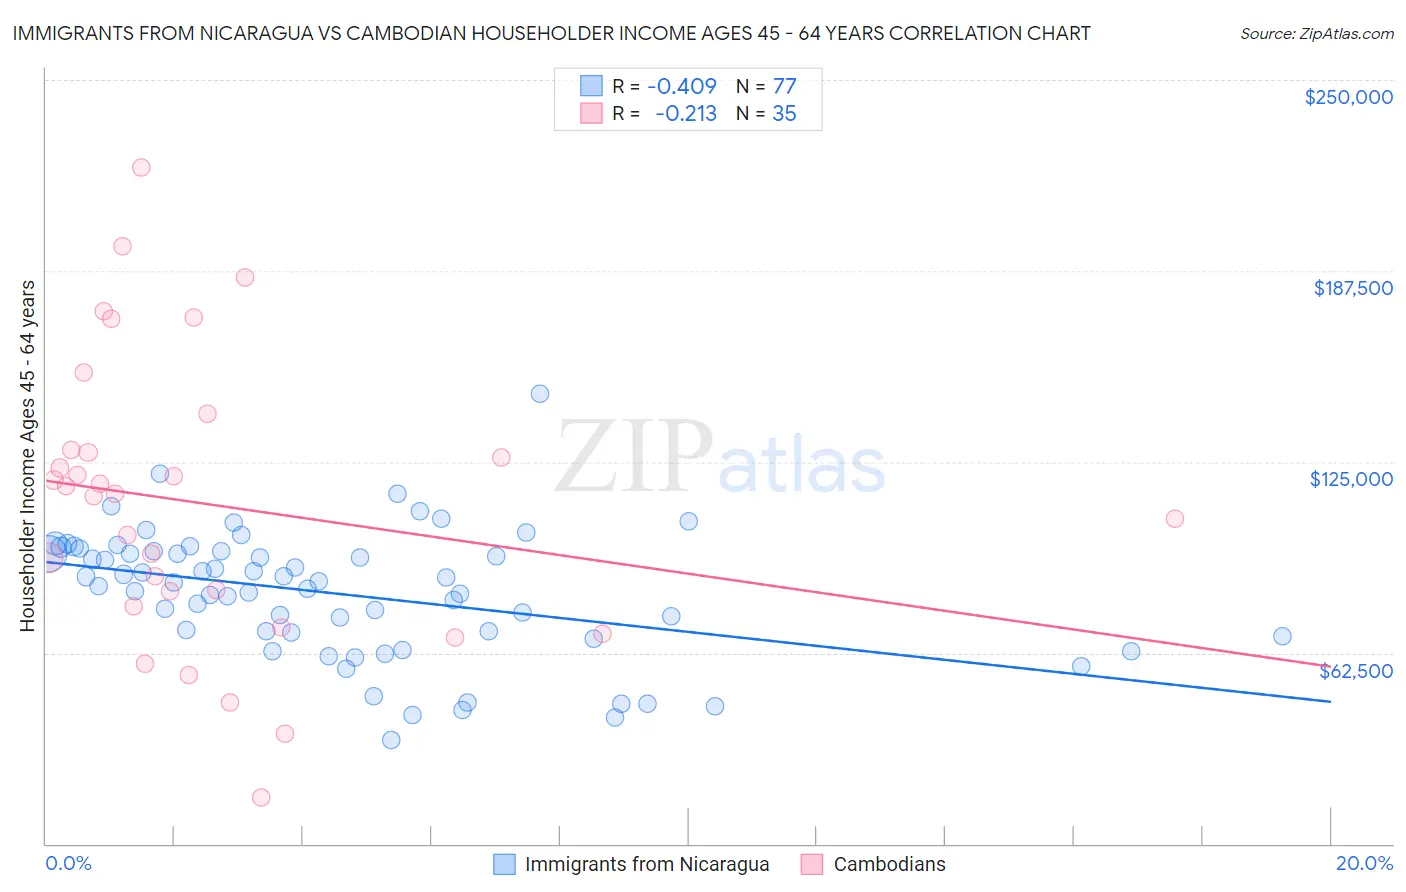
Immigrants from Nicaragua vs Cambodian Householder Income Ages 45 - 64 years Correlation Chart
The statistical analysis conducted on geographies consisting of 236,224,190 people shows a moderate negative correlation between the proportion of Immigrants from Nicaragua and household income with householder between the ages 45 and 64 in the United States with a correlation coefficient (R) of -0.409 and weighted average of $89,108. Similarly, the statistical analysis conducted on geographies consisting of 102,430,914 people shows a weak negative correlation between the proportion of Cambodians and household income with householder between the ages 45 and 64 in the United States with a correlation coefficient (R) of -0.213 and weighted average of $114,342, a difference of 28.3%.
Householder Income Ages 45 - 64 years Correlation Summary
| Measurement | Immigrants from Nicaragua | Cambodian |
| Minimum | $33,906 | $15,079 |
| Maximum | $147,500 | $221,500 |
| Range | $113,594 | $206,421 |
| Mean | $81,875 | $111,198 |
| Median | $85,711 | $114,622 |
| Interquartile 25% (IQ1) | $68,574 | $77,671 |
| Interquartile 75% (IQ3) | $95,783 | $128,994 |
| Interquartile Range (IQR) | $27,209 | $51,323 |
| Standard Deviation (Sample) | $20,905 | $46,823 |
| Standard Deviation (Population) | $20,769 | $46,149 |
Similar Demographics by Householder Income Ages 45 - 64 years
Demographics Similar to Immigrants from Nicaragua by Householder Income Ages 45 - 64 years
In terms of householder income ages 45 - 64 years, the demographic groups most similar to Immigrants from Nicaragua are Liberian ($88,929, a difference of 0.20%), Immigrants from Barbados ($89,394, a difference of 0.32%), German Russian ($89,398, a difference of 0.33%), Belizean ($88,684, a difference of 0.48%), and Somali ($88,600, a difference of 0.57%).
| Demographics | Rating | Rank | Householder Income Ages 45 - 64 years |
| Marshallese | 0.7 /100 | #252 | Tragic $90,455 |
| Barbadians | 0.6 /100 | #253 | Tragic $90,266 |
| Immigrants | Guyana | 0.6 /100 | #254 | Tragic $90,186 |
| West Indians | 0.5 /100 | #255 | Tragic $89,906 |
| French American Indians | 0.5 /100 | #256 | Tragic $89,811 |
| German Russians | 0.4 /100 | #257 | Tragic $89,398 |
| Immigrants | Barbados | 0.4 /100 | #258 | Tragic $89,394 |
| Immigrants | Nicaragua | 0.4 /100 | #259 | Tragic $89,108 |
| Liberians | 0.3 /100 | #260 | Tragic $88,929 |
| Belizeans | 0.3 /100 | #261 | Tragic $88,684 |
| Somalis | 0.3 /100 | #262 | Tragic $88,600 |
| Immigrants | Senegal | 0.3 /100 | #263 | Tragic $88,421 |
| Osage | 0.3 /100 | #264 | Tragic $88,390 |
| Jamaicans | 0.2 /100 | #265 | Tragic $88,327 |
| Immigrants | West Indies | 0.2 /100 | #266 | Tragic $88,164 |
Demographics Similar to Cambodians by Householder Income Ages 45 - 64 years
In terms of householder income ages 45 - 64 years, the demographic groups most similar to Cambodians are Immigrants from Lithuania ($114,336, a difference of 0.010%), Immigrants from Turkey ($114,407, a difference of 0.060%), Immigrants from Pakistan ($114,434, a difference of 0.080%), Estonian ($114,220, a difference of 0.11%), and Israeli ($114,186, a difference of 0.14%).
| Demographics | Rating | Rank | Householder Income Ages 45 - 64 years |
| Chinese | 100.0 /100 | #33 | Exceptional $116,156 |
| Immigrants | Denmark | 100.0 /100 | #34 | Exceptional $116,000 |
| Latvians | 100.0 /100 | #35 | Exceptional $115,957 |
| Immigrants | Switzerland | 100.0 /100 | #36 | Exceptional $115,934 |
| Maltese | 99.9 /100 | #37 | Exceptional $114,754 |
| Immigrants | Pakistan | 99.9 /100 | #38 | Exceptional $114,434 |
| Immigrants | Turkey | 99.9 /100 | #39 | Exceptional $114,407 |
| Cambodians | 99.9 /100 | #40 | Exceptional $114,342 |
| Immigrants | Lithuania | 99.9 /100 | #41 | Exceptional $114,336 |
| Estonians | 99.9 /100 | #42 | Exceptional $114,220 |
| Israelis | 99.9 /100 | #43 | Exceptional $114,186 |
| Bulgarians | 99.9 /100 | #44 | Exceptional $113,883 |
| Immigrants | France | 99.9 /100 | #45 | Exceptional $113,680 |
| Immigrants | Greece | 99.9 /100 | #46 | Exceptional $113,548 |
| Australians | 99.9 /100 | #47 | Exceptional $113,533 |