Immigrants from Nicaragua vs Immigrants from Panama In Labor Force | Age 20-64
COMPARE
Immigrants from Nicaragua
Immigrants from Panama
In Labor Force | Age 20-64
In Labor Force | Age 20-64 Comparison
Immigrants from Nicaragua
Immigrants from Panama
79.3%
IN LABOR FORCE | AGE 20-64
19.0/ 100
METRIC RATING
201st/ 347
METRIC RANK
79.1%
IN LABOR FORCE | AGE 20-64
6.9/ 100
METRIC RATING
222nd/ 347
METRIC RANK
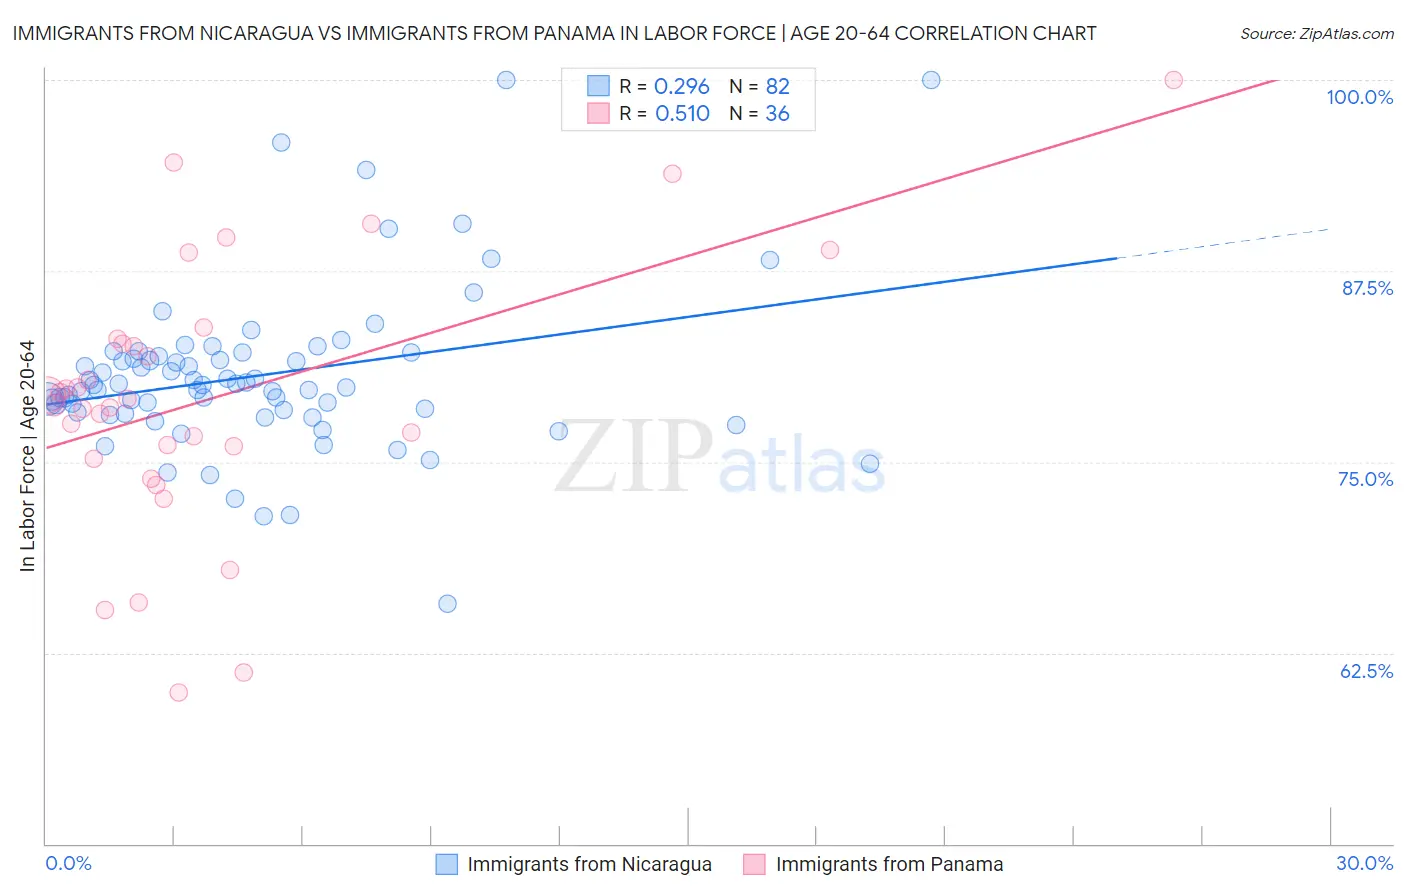
Immigrants from Nicaragua vs Immigrants from Panama In Labor Force | Age 20-64 Correlation Chart
The statistical analysis conducted on geographies consisting of 236,331,961 people shows a weak positive correlation between the proportion of Immigrants from Nicaragua and labor force participation rate among population between the ages 20 and 64 in the United States with a correlation coefficient (R) of 0.296 and weighted average of 79.3%. Similarly, the statistical analysis conducted on geographies consisting of 221,185,422 people shows a substantial positive correlation between the proportion of Immigrants from Panama and labor force participation rate among population between the ages 20 and 64 in the United States with a correlation coefficient (R) of 0.510 and weighted average of 79.1%, a difference of 0.23%.
In Labor Force | Age 20-64 Correlation Summary
| Measurement | Immigrants from Nicaragua | Immigrants from Panama |
| Minimum | 65.7% | 59.9% |
| Maximum | 100.0% | 100.0% |
| Range | 34.3% | 40.1% |
| Mean | 80.6% | 79.2% |
| Median | 80.0% | 78.9% |
| Interquartile 25% (IQ1) | 78.2% | 75.6% |
| Interquartile 75% (IQ3) | 81.9% | 82.9% |
| Interquartile Range (IQR) | 3.7% | 7.3% |
| Standard Deviation (Sample) | 5.4% | 8.8% |
| Standard Deviation (Population) | 5.4% | 8.7% |
Similar Demographics by In Labor Force | Age 20-64
Demographics Similar to Immigrants from Nicaragua by In Labor Force | Age 20-64
In terms of in labor force | age 20-64, the demographic groups most similar to Immigrants from Nicaragua are Immigrants from Oceania (79.3%, a difference of 0.0%), Nicaraguan (79.3%, a difference of 0.010%), Dutch (79.3%, a difference of 0.020%), Iraqi (79.3%, a difference of 0.020%), and Immigrants from Cambodia (79.3%, a difference of 0.020%).
| Demographics | Rating | Rank | In Labor Force | Age 20-64 |
| Immigrants | Thailand | 24.8 /100 | #194 | Fair 79.4% |
| Immigrants | Austria | 23.7 /100 | #195 | Fair 79.4% |
| Ecuadorians | 23.1 /100 | #196 | Fair 79.4% |
| Immigrants | Senegal | 22.5 /100 | #197 | Fair 79.4% |
| Immigrants | Laos | 21.5 /100 | #198 | Fair 79.4% |
| Dutch | 20.2 /100 | #199 | Fair 79.3% |
| Immigrants | Oceania | 19.1 /100 | #200 | Poor 79.3% |
| Immigrants | Nicaragua | 19.0 /100 | #201 | Poor 79.3% |
| Nicaraguans | 18.3 /100 | #202 | Poor 79.3% |
| Iraqis | 17.7 /100 | #203 | Poor 79.3% |
| Immigrants | Cambodia | 17.6 /100 | #204 | Poor 79.3% |
| Immigrants | Congo | 17.5 /100 | #205 | Poor 79.3% |
| Immigrants | Ecuador | 16.9 /100 | #206 | Poor 79.3% |
| Sub-Saharan Africans | 16.5 /100 | #207 | Poor 79.3% |
| British | 16.5 /100 | #208 | Poor 79.3% |
Demographics Similar to Immigrants from Panama by In Labor Force | Age 20-64
In terms of in labor force | age 20-64, the demographic groups most similar to Immigrants from Panama are Canadian (79.1%, a difference of 0.0%), Immigrants from Uzbekistan (79.1%, a difference of 0.0%), Hungarian (79.2%, a difference of 0.010%), Portuguese (79.1%, a difference of 0.020%), and Immigrants (79.2%, a difference of 0.030%).
| Demographics | Rating | Rank | In Labor Force | Age 20-64 |
| Immigrants | Norway | 12.0 /100 | #215 | Poor 79.2% |
| Arabs | 11.4 /100 | #216 | Poor 79.2% |
| Immigrants | Western Asia | 11.0 /100 | #217 | Poor 79.2% |
| Immigrants | England | 9.3 /100 | #218 | Tragic 79.2% |
| French Canadians | 8.4 /100 | #219 | Tragic 79.2% |
| Immigrants | Immigrants | 7.7 /100 | #220 | Tragic 79.2% |
| Hungarians | 7.2 /100 | #221 | Tragic 79.2% |
| Immigrants | Panama | 6.9 /100 | #222 | Tragic 79.1% |
| Canadians | 6.8 /100 | #223 | Tragic 79.1% |
| Immigrants | Uzbekistan | 6.8 /100 | #224 | Tragic 79.1% |
| Portuguese | 6.4 /100 | #225 | Tragic 79.1% |
| Central Americans | 5.9 /100 | #226 | Tragic 79.1% |
| Immigrants | Western Europe | 5.9 /100 | #227 | Tragic 79.1% |
| Panamanians | 5.7 /100 | #228 | Tragic 79.1% |
| Alsatians | 5.7 /100 | #229 | Tragic 79.1% |