Immigrants from Nicaragua vs Finnish Householder Income Ages 45 - 64 years
COMPARE
Immigrants from Nicaragua
Finnish
Householder Income Ages 45 - 64 years
Householder Income Ages 45 - 64 years Comparison
Immigrants from Nicaragua
Finns
$89,108
HOUSEHOLDER INCOME AGES 45 - 64 YEARS
0.4/ 100
METRIC RATING
259th/ 347
METRIC RANK
$99,904
HOUSEHOLDER INCOME AGES 45 - 64 YEARS
44.8/ 100
METRIC RATING
182nd/ 347
METRIC RANK
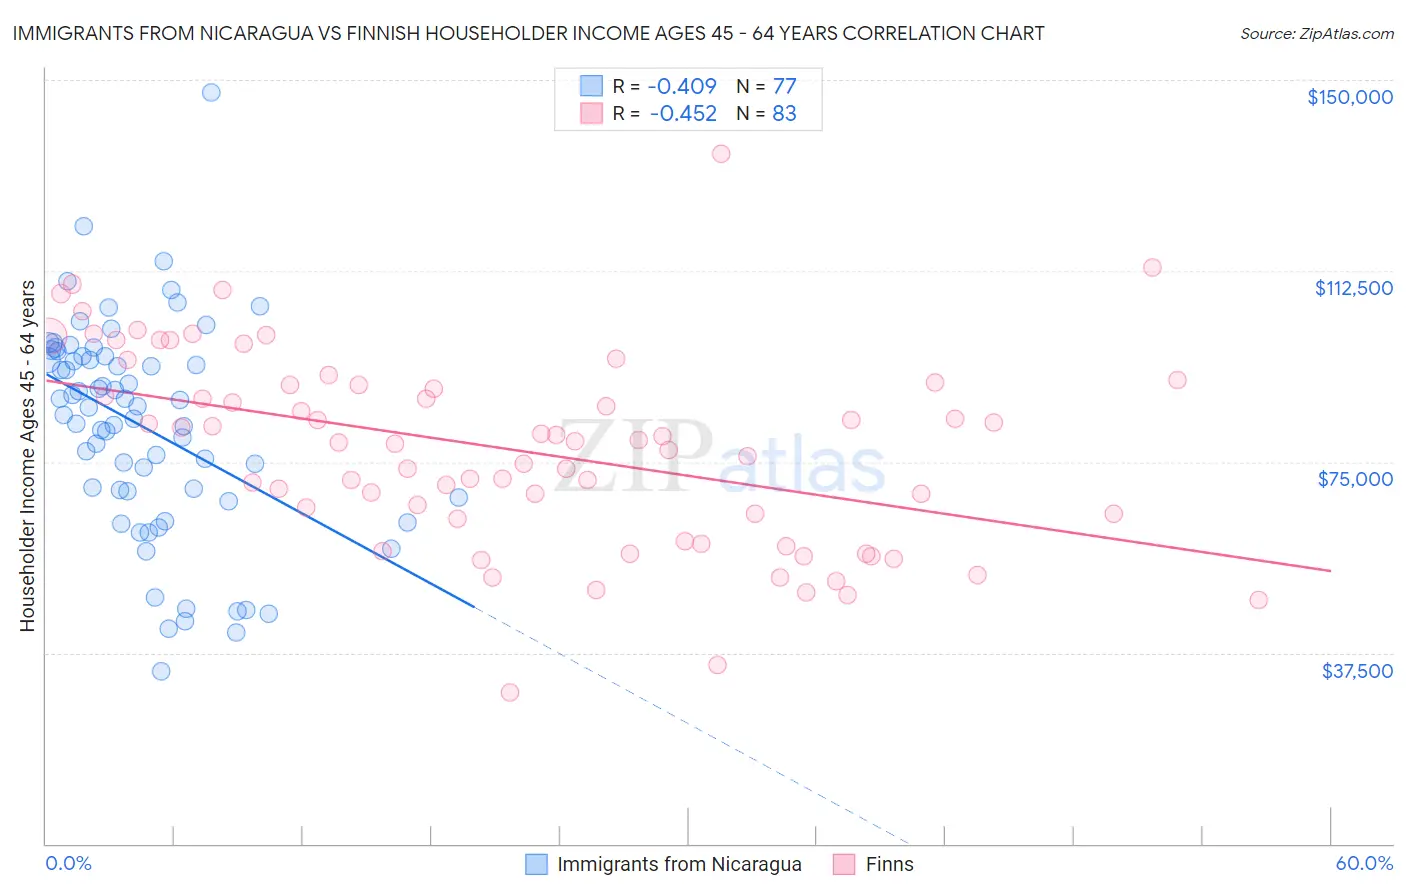
Immigrants from Nicaragua vs Finnish Householder Income Ages 45 - 64 years Correlation Chart
The statistical analysis conducted on geographies consisting of 236,224,190 people shows a moderate negative correlation between the proportion of Immigrants from Nicaragua and household income with householder between the ages 45 and 64 in the United States with a correlation coefficient (R) of -0.409 and weighted average of $89,108. Similarly, the statistical analysis conducted on geographies consisting of 404,016,937 people shows a moderate negative correlation between the proportion of Finns and household income with householder between the ages 45 and 64 in the United States with a correlation coefficient (R) of -0.452 and weighted average of $99,904, a difference of 12.1%.
Householder Income Ages 45 - 64 years Correlation Summary
| Measurement | Immigrants from Nicaragua | Finnish |
| Minimum | $33,906 | $29,583 |
| Maximum | $147,500 | $135,625 |
| Range | $113,594 | $106,042 |
| Mean | $81,875 | $77,268 |
| Median | $85,711 | $78,849 |
| Interquartile 25% (IQ1) | $68,574 | $63,712 |
| Interquartile 75% (IQ3) | $95,783 | $90,163 |
| Interquartile Range (IQR) | $27,209 | $26,451 |
| Standard Deviation (Sample) | $20,905 | $19,265 |
| Standard Deviation (Population) | $20,769 | $19,148 |
Similar Demographics by Householder Income Ages 45 - 64 years
Demographics Similar to Immigrants from Nicaragua by Householder Income Ages 45 - 64 years
In terms of householder income ages 45 - 64 years, the demographic groups most similar to Immigrants from Nicaragua are Liberian ($88,929, a difference of 0.20%), Immigrants from Barbados ($89,394, a difference of 0.32%), German Russian ($89,398, a difference of 0.33%), Belizean ($88,684, a difference of 0.48%), and Somali ($88,600, a difference of 0.57%).
| Demographics | Rating | Rank | Householder Income Ages 45 - 64 years |
| Marshallese | 0.7 /100 | #252 | Tragic $90,455 |
| Barbadians | 0.6 /100 | #253 | Tragic $90,266 |
| Immigrants | Guyana | 0.6 /100 | #254 | Tragic $90,186 |
| West Indians | 0.5 /100 | #255 | Tragic $89,906 |
| French American Indians | 0.5 /100 | #256 | Tragic $89,811 |
| German Russians | 0.4 /100 | #257 | Tragic $89,398 |
| Immigrants | Barbados | 0.4 /100 | #258 | Tragic $89,394 |
| Immigrants | Nicaragua | 0.4 /100 | #259 | Tragic $89,108 |
| Liberians | 0.3 /100 | #260 | Tragic $88,929 |
| Belizeans | 0.3 /100 | #261 | Tragic $88,684 |
| Somalis | 0.3 /100 | #262 | Tragic $88,600 |
| Immigrants | Senegal | 0.3 /100 | #263 | Tragic $88,421 |
| Osage | 0.3 /100 | #264 | Tragic $88,390 |
| Jamaicans | 0.2 /100 | #265 | Tragic $88,327 |
| Immigrants | West Indies | 0.2 /100 | #266 | Tragic $88,164 |
Demographics Similar to Finns by Householder Income Ages 45 - 64 years
In terms of householder income ages 45 - 64 years, the demographic groups most similar to Finns are Spaniard ($99,889, a difference of 0.010%), Immigrants ($99,943, a difference of 0.040%), French ($99,824, a difference of 0.080%), Colombian ($99,772, a difference of 0.13%), and Aleut ($100,052, a difference of 0.15%).
| Demographics | Rating | Rank | Householder Income Ages 45 - 64 years |
| Germans | 48.8 /100 | #175 | Average $100,224 |
| Immigrants | Costa Rica | 47.7 /100 | #176 | Average $100,141 |
| Moroccans | 47.7 /100 | #177 | Average $100,138 |
| Immigrants | Cameroon | 47.0 /100 | #178 | Average $100,084 |
| Belgians | 46.7 /100 | #179 | Average $100,060 |
| Aleuts | 46.6 /100 | #180 | Average $100,052 |
| Immigrants | Immigrants | 45.3 /100 | #181 | Average $99,943 |
| Finns | 44.8 /100 | #182 | Average $99,904 |
| Spaniards | 44.6 /100 | #183 | Average $99,889 |
| French | 43.8 /100 | #184 | Average $99,824 |
| Colombians | 43.2 /100 | #185 | Average $99,772 |
| Dutch | 41.7 /100 | #186 | Average $99,650 |
| Iraqis | 38.5 /100 | #187 | Fair $99,387 |
| Immigrants | Portugal | 36.3 /100 | #188 | Fair $99,203 |
| Immigrants | South America | 35.4 /100 | #189 | Fair $99,126 |