Venezuelan vs Immigrants from Panama Householder Income Ages 45 - 64 years
COMPARE
Venezuelan
Immigrants from Panama
Householder Income Ages 45 - 64 years
Householder Income Ages 45 - 64 years Comparison
Venezuelans
Immigrants from Panama
$96,460
HOUSEHOLDER INCOME AGES 45 - 64 YEARS
12.6/ 100
METRIC RATING
212th/ 347
METRIC RANK
$93,815
HOUSEHOLDER INCOME AGES 45 - 64 YEARS
3.7/ 100
METRIC RATING
228th/ 347
METRIC RANK
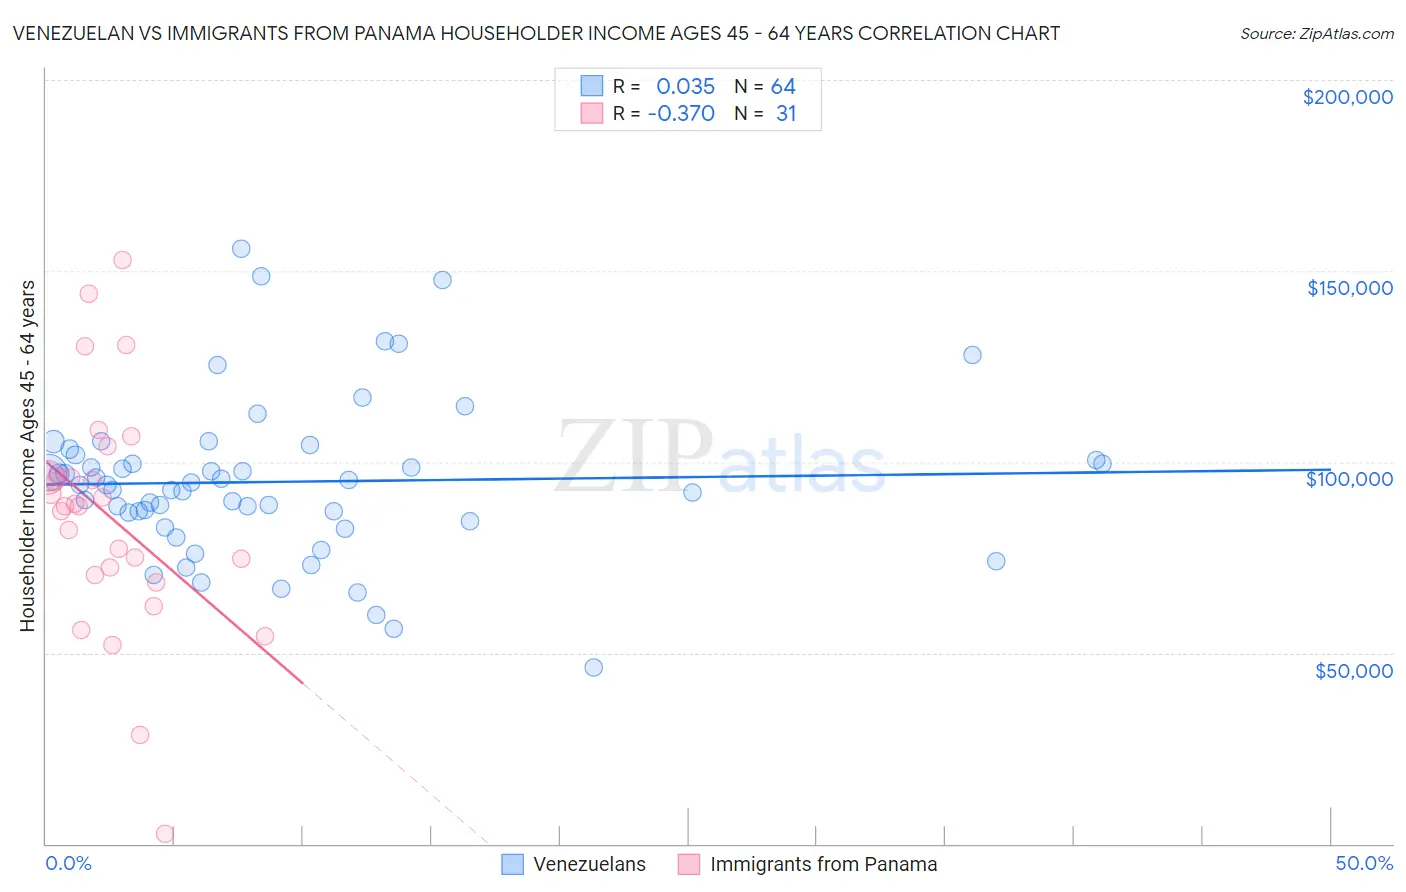
Venezuelan vs Immigrants from Panama Householder Income Ages 45 - 64 years Correlation Chart
The statistical analysis conducted on geographies consisting of 305,898,329 people shows no correlation between the proportion of Venezuelans and household income with householder between the ages 45 and 64 in the United States with a correlation coefficient (R) of 0.035 and weighted average of $96,460. Similarly, the statistical analysis conducted on geographies consisting of 221,006,827 people shows a mild negative correlation between the proportion of Immigrants from Panama and household income with householder between the ages 45 and 64 in the United States with a correlation coefficient (R) of -0.370 and weighted average of $93,815, a difference of 2.8%.
Householder Income Ages 45 - 64 years Correlation Summary
| Measurement | Venezuelan | Immigrants from Panama |
| Minimum | $46,250 | $2,499 |
| Maximum | $155,899 | $152,844 |
| Range | $109,649 | $150,345 |
| Mean | $94,776 | $86,009 |
| Median | $94,033 | $88,407 |
| Interquartile 25% (IQ1) | $85,499 | $70,337 |
| Interquartile 75% (IQ3) | $101,274 | $96,322 |
| Interquartile Range (IQR) | $15,775 | $25,984 |
| Standard Deviation (Sample) | $20,798 | $30,853 |
| Standard Deviation (Population) | $20,635 | $30,351 |
Demographics Similar to Venezuelans and Immigrants from Panama by Householder Income Ages 45 - 64 years
In terms of householder income ages 45 - 64 years, the demographic groups most similar to Venezuelans are Immigrants from Cambodia ($96,537, a difference of 0.080%), Tsimshian ($96,783, a difference of 0.34%), Immigrants from Uruguay ($96,086, a difference of 0.39%), Panamanian ($96,066, a difference of 0.41%), and Nigerian ($95,492, a difference of 1.0%). Similarly, the demographic groups most similar to Immigrants from Panama are Vietnamese ($93,788, a difference of 0.030%), Immigrants from Sudan ($93,781, a difference of 0.040%), Alaska Native ($93,991, a difference of 0.19%), Immigrants from the Azores ($94,138, a difference of 0.34%), and Bermudan ($94,197, a difference of 0.41%).
| Demographics | Rating | Rank | Householder Income Ages 45 - 64 years |
| Tsimshian | 14.5 /100 | #210 | Poor $96,783 |
| Immigrants | Cambodia | 13.0 /100 | #211 | Poor $96,537 |
| Venezuelans | 12.6 /100 | #212 | Poor $96,460 |
| Immigrants | Uruguay | 10.7 /100 | #213 | Poor $96,086 |
| Panamanians | 10.6 /100 | #214 | Poor $96,066 |
| Nigerians | 8.2 /100 | #215 | Tragic $95,492 |
| Immigrants | Venezuela | 7.6 /100 | #216 | Tragic $95,342 |
| Immigrants | Ghana | 6.4 /100 | #217 | Tragic $94,982 |
| Delaware | 6.2 /100 | #218 | Tragic $94,914 |
| Immigrants | Armenia | 6.1 /100 | #219 | Tragic $94,863 |
| Salvadorans | 6.0 /100 | #220 | Tragic $94,842 |
| Immigrants | Nigeria | 5.9 /100 | #221 | Tragic $94,804 |
| Malaysians | 5.2 /100 | #222 | Tragic $94,517 |
| Immigrants | Nonimmigrants | 5.0 /100 | #223 | Tragic $94,448 |
| Immigrants | Bosnia and Herzegovina | 4.6 /100 | #224 | Tragic $94,288 |
| Bermudans | 4.4 /100 | #225 | Tragic $94,197 |
| Immigrants | Azores | 4.3 /100 | #226 | Tragic $94,138 |
| Alaska Natives | 4.0 /100 | #227 | Tragic $93,991 |
| Immigrants | Panama | 3.7 /100 | #228 | Tragic $93,815 |
| Vietnamese | 3.6 /100 | #229 | Tragic $93,788 |
| Immigrants | Sudan | 3.6 /100 | #230 | Tragic $93,781 |