Immigrants from St. Vincent and the Grenadines vs Immigrants from Panama Householder Income Ages 45 - 64 years
COMPARE
Immigrants from St. Vincent and the Grenadines
Immigrants from Panama
Householder Income Ages 45 - 64 years
Householder Income Ages 45 - 64 years Comparison
Immigrants from St. Vincent and the Grenadines
Immigrants from Panama
$86,394
HOUSEHOLDER INCOME AGES 45 - 64 YEARS
0.1/ 100
METRIC RATING
288th/ 347
METRIC RANK
$93,815
HOUSEHOLDER INCOME AGES 45 - 64 YEARS
3.7/ 100
METRIC RATING
228th/ 347
METRIC RANK
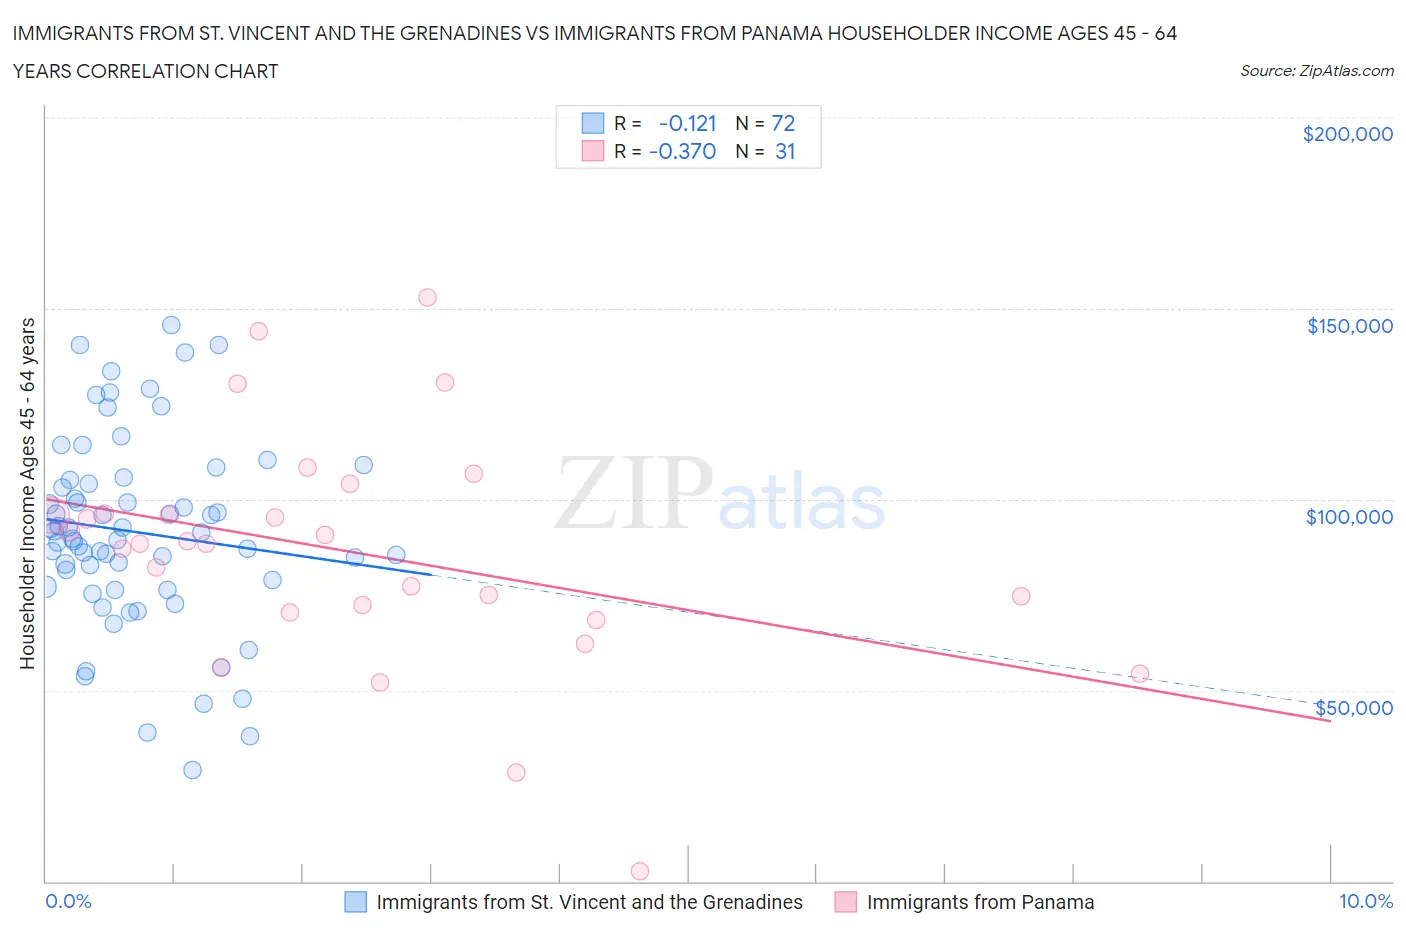
Immigrants from St. Vincent and the Grenadines vs Immigrants from Panama Householder Income Ages 45 - 64 years Correlation Chart
The statistical analysis conducted on geographies consisting of 56,172,416 people shows a poor negative correlation between the proportion of Immigrants from St. Vincent and the Grenadines and household income with householder between the ages 45 and 64 in the United States with a correlation coefficient (R) of -0.121 and weighted average of $86,394. Similarly, the statistical analysis conducted on geographies consisting of 221,006,827 people shows a mild negative correlation between the proportion of Immigrants from Panama and household income with householder between the ages 45 and 64 in the United States with a correlation coefficient (R) of -0.370 and weighted average of $93,815, a difference of 8.6%.
Householder Income Ages 45 - 64 years Correlation Summary
| Measurement | Immigrants from St. Vincent and the Grenadines | Immigrants from Panama |
| Minimum | $29,032 | $2,499 |
| Maximum | $145,625 | $152,844 |
| Range | $116,593 | $150,345 |
| Mean | $91,362 | $86,009 |
| Median | $90,616 | $88,407 |
| Interquartile 25% (IQ1) | $78,013 | $70,337 |
| Interquartile 75% (IQ3) | $104,689 | $96,322 |
| Interquartile Range (IQR) | $26,677 | $25,984 |
| Standard Deviation (Sample) | $24,861 | $30,853 |
| Standard Deviation (Population) | $24,688 | $30,351 |
Similar Demographics by Householder Income Ages 45 - 64 years
Demographics Similar to Immigrants from St. Vincent and the Grenadines by Householder Income Ages 45 - 64 years
In terms of householder income ages 45 - 64 years, the demographic groups most similar to Immigrants from St. Vincent and the Grenadines are Bangladeshi ($86,402, a difference of 0.010%), Cuban ($86,301, a difference of 0.11%), Immigrants from Guatemala ($86,573, a difference of 0.21%), Blackfeet ($86,595, a difference of 0.23%), and Cherokee ($86,125, a difference of 0.31%).
| Demographics | Rating | Rank | Householder Income Ages 45 - 64 years |
| Yaqui | 0.1 /100 | #281 | Tragic $86,914 |
| Senegalese | 0.1 /100 | #282 | Tragic $86,897 |
| Mexicans | 0.1 /100 | #283 | Tragic $86,816 |
| Central American Indians | 0.1 /100 | #284 | Tragic $86,764 |
| Blackfeet | 0.1 /100 | #285 | Tragic $86,595 |
| Immigrants | Guatemala | 0.1 /100 | #286 | Tragic $86,573 |
| Bangladeshis | 0.1 /100 | #287 | Tragic $86,402 |
| Immigrants | St. Vincent and the Grenadines | 0.1 /100 | #288 | Tragic $86,394 |
| Cubans | 0.1 /100 | #289 | Tragic $86,301 |
| Cherokee | 0.1 /100 | #290 | Tragic $86,125 |
| Hispanics or Latinos | 0.1 /100 | #291 | Tragic $86,006 |
| Immigrants | Central America | 0.1 /100 | #292 | Tragic $85,965 |
| Comanche | 0.1 /100 | #293 | Tragic $85,787 |
| British West Indians | 0.1 /100 | #294 | Tragic $85,571 |
| Immigrants | Grenada | 0.1 /100 | #295 | Tragic $85,552 |
Demographics Similar to Immigrants from Panama by Householder Income Ages 45 - 64 years
In terms of householder income ages 45 - 64 years, the demographic groups most similar to Immigrants from Panama are Vietnamese ($93,788, a difference of 0.030%), Immigrants from Sudan ($93,781, a difference of 0.040%), Ecuadorian ($93,739, a difference of 0.080%), Sudanese ($93,718, a difference of 0.10%), and Alaska Native ($93,991, a difference of 0.19%).
| Demographics | Rating | Rank | Householder Income Ages 45 - 64 years |
| Immigrants | Nigeria | 5.9 /100 | #221 | Tragic $94,804 |
| Malaysians | 5.2 /100 | #222 | Tragic $94,517 |
| Immigrants | Nonimmigrants | 5.0 /100 | #223 | Tragic $94,448 |
| Immigrants | Bosnia and Herzegovina | 4.6 /100 | #224 | Tragic $94,288 |
| Bermudans | 4.4 /100 | #225 | Tragic $94,197 |
| Immigrants | Azores | 4.3 /100 | #226 | Tragic $94,138 |
| Alaska Natives | 4.0 /100 | #227 | Tragic $93,991 |
| Immigrants | Panama | 3.7 /100 | #228 | Tragic $93,815 |
| Vietnamese | 3.6 /100 | #229 | Tragic $93,788 |
| Immigrants | Sudan | 3.6 /100 | #230 | Tragic $93,781 |
| Ecuadorians | 3.6 /100 | #231 | Tragic $93,739 |
| Sudanese | 3.5 /100 | #232 | Tragic $93,718 |
| Nepalese | 3.0 /100 | #233 | Tragic $93,355 |
| Immigrants | El Salvador | 2.7 /100 | #234 | Tragic $93,176 |
| Nicaraguans | 2.0 /100 | #235 | Tragic $92,554 |