Immigrants from Nepal vs European Median Earnings
COMPARE
Immigrants from Nepal
European
Median Earnings
Median Earnings Comparison
Immigrants from Nepal
Europeans
$47,925
MEDIAN EARNINGS
89.0/ 100
METRIC RATING
137th/ 347
METRIC RANK
$47,915
MEDIAN EARNINGS
88.9/ 100
METRIC RATING
138th/ 347
METRIC RANK
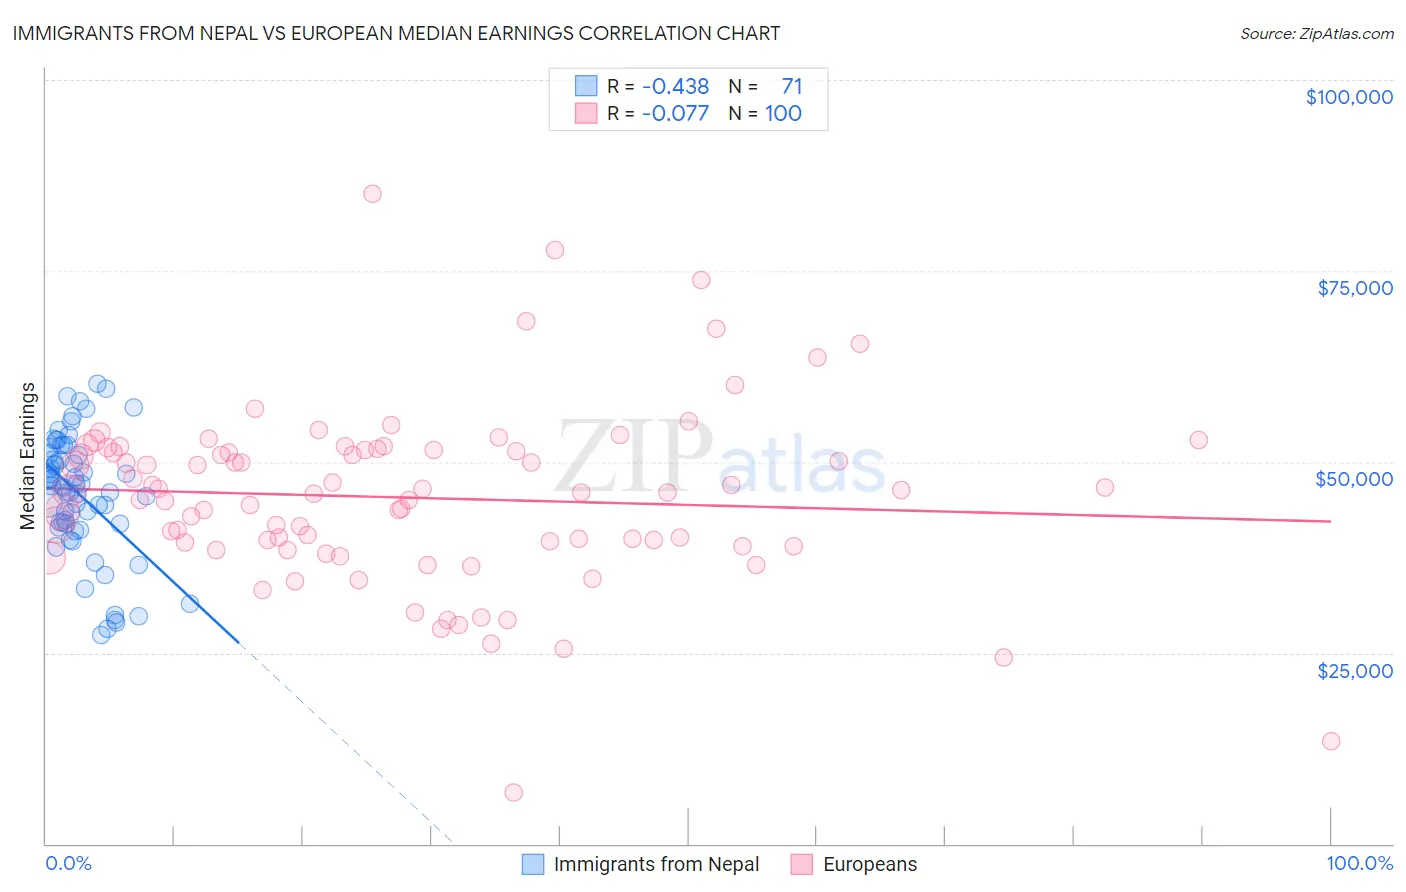
Immigrants from Nepal vs European Median Earnings Correlation Chart
The statistical analysis conducted on geographies consisting of 186,786,511 people shows a moderate negative correlation between the proportion of Immigrants from Nepal and median earnings in the United States with a correlation coefficient (R) of -0.438 and weighted average of $47,925. Similarly, the statistical analysis conducted on geographies consisting of 561,558,991 people shows a slight negative correlation between the proportion of Europeans and median earnings in the United States with a correlation coefficient (R) of -0.077 and weighted average of $47,915, a difference of 0.020%.
Median Earnings Correlation Summary
| Measurement | Immigrants from Nepal | European |
| Minimum | $27,307 | $6,651 |
| Maximum | $60,227 | $85,181 |
| Range | $32,920 | $78,530 |
| Mean | $45,713 | $45,294 |
| Median | $46,771 | $45,994 |
| Interquartile 25% (IQ1) | $41,930 | $39,170 |
| Interquartile 75% (IQ3) | $51,099 | $51,535 |
| Interquartile Range (IQR) | $9,169 | $12,364 |
| Standard Deviation (Sample) | $7,950 | $11,738 |
| Standard Deviation (Population) | $7,894 | $11,679 |
Demographics Similar to Immigrants from Nepal and Europeans by Median Earnings
In terms of median earnings, the demographic groups most similar to Immigrants from Nepal are Canadian ($47,911, a difference of 0.030%), Taiwanese ($47,902, a difference of 0.050%), Immigrants from Sierra Leone ($47,875, a difference of 0.11%), Slovene ($47,995, a difference of 0.15%), and Ugandan ($47,854, a difference of 0.15%). Similarly, the demographic groups most similar to Europeans are Canadian ($47,911, a difference of 0.010%), Taiwanese ($47,902, a difference of 0.030%), Immigrants from Sierra Leone ($47,875, a difference of 0.080%), Ugandan ($47,854, a difference of 0.13%), and Swedish ($47,851, a difference of 0.13%).
| Demographics | Rating | Rank | Median Earnings |
| Sierra Leoneans | 93.1 /100 | #127 | Exceptional $48,286 |
| Immigrants | Philippines | 92.9 /100 | #128 | Exceptional $48,266 |
| Pakistanis | 92.8 /100 | #129 | Exceptional $48,254 |
| Zimbabweans | 92.6 /100 | #130 | Exceptional $48,229 |
| Lebanese | 92.5 /100 | #131 | Exceptional $48,226 |
| British | 92.2 /100 | #132 | Exceptional $48,189 |
| Immigrants | Uganda | 90.5 /100 | #133 | Exceptional $48,041 |
| Sri Lankans | 90.5 /100 | #134 | Exceptional $48,040 |
| Portuguese | 90.4 /100 | #135 | Exceptional $48,032 |
| Slovenes | 90.0 /100 | #136 | Excellent $47,995 |
| Immigrants | Nepal | 89.0 /100 | #137 | Excellent $47,925 |
| Europeans | 88.9 /100 | #138 | Excellent $47,915 |
| Canadians | 88.8 /100 | #139 | Excellent $47,911 |
| Taiwanese | 88.7 /100 | #140 | Excellent $47,902 |
| Immigrants | Sierra Leone | 88.3 /100 | #141 | Excellent $47,875 |
| Ugandans | 88.0 /100 | #142 | Excellent $47,854 |
| Swedes | 88.0 /100 | #143 | Excellent $47,851 |
| Hungarians | 87.1 /100 | #144 | Excellent $47,795 |
| Immigrants | Saudi Arabia | 85.6 /100 | #145 | Excellent $47,704 |
| Immigrants | Chile | 85.5 /100 | #146 | Excellent $47,697 |
| Immigrants | South Eastern Asia | 85.0 /100 | #147 | Excellent $47,671 |