Immigrants from Nepal vs Irish Male Unemployment
COMPARE
Immigrants from Nepal
Irish
Male Unemployment
Male Unemployment Comparison
Immigrants from Nepal
Irish
4.8%
MALE UNEMPLOYMENT
99.8/ 100
METRIC RATING
32nd/ 347
METRIC RANK
5.0%
MALE UNEMPLOYMENT
98.8/ 100
METRIC RATING
52nd/ 347
METRIC RANK
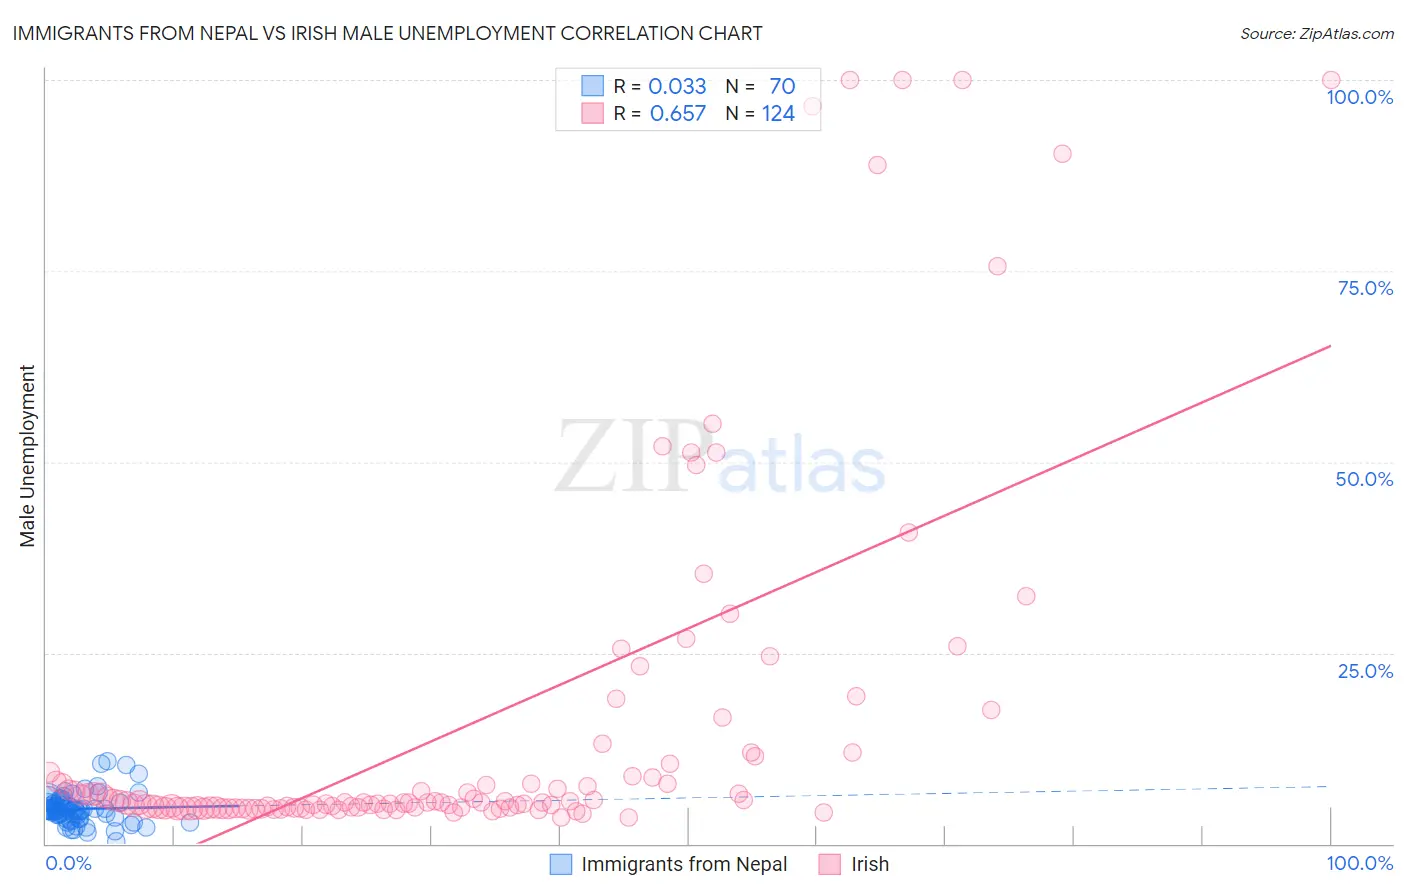
Immigrants from Nepal vs Irish Male Unemployment Correlation Chart
The statistical analysis conducted on geographies consisting of 186,501,953 people shows no correlation between the proportion of Immigrants from Nepal and unemployment rate among males in the United States with a correlation coefficient (R) of 0.033 and weighted average of 4.8%. Similarly, the statistical analysis conducted on geographies consisting of 566,974,673 people shows a significant positive correlation between the proportion of Irish and unemployment rate among males in the United States with a correlation coefficient (R) of 0.657 and weighted average of 5.0%, a difference of 2.5%.
Male Unemployment Correlation Summary
| Measurement | Immigrants from Nepal | Irish |
| Minimum | 0.30% | 3.4% |
| Maximum | 10.8% | 100.0% |
| Range | 10.5% | 96.6% |
| Mean | 4.6% | 15.4% |
| Median | 4.5% | 5.4% |
| Interquartile 25% (IQ1) | 3.4% | 4.7% |
| Interquartile 75% (IQ3) | 5.4% | 9.9% |
| Interquartile Range (IQR) | 2.0% | 5.2% |
| Standard Deviation (Sample) | 2.0% | 23.5% |
| Standard Deviation (Population) | 2.0% | 23.4% |
Demographics Similar to Immigrants from Nepal and Irish by Male Unemployment
In terms of male unemployment, the demographic groups most similar to Immigrants from Nepal are Latvian (4.8%, a difference of 0.30%), Welsh (4.8%, a difference of 0.38%), Paraguayan (4.9%, a difference of 1.2%), Immigrants from Singapore (4.9%, a difference of 1.3%), and Scotch-Irish (4.9%, a difference of 1.5%). Similarly, the demographic groups most similar to Irish are Slovene (5.0%, a difference of 0.020%), Polish (4.9%, a difference of 0.060%), Croatian (4.9%, a difference of 0.060%), Immigrants from Scotland (4.9%, a difference of 0.080%), and Austrian (4.9%, a difference of 0.090%).
| Demographics | Rating | Rank | Male Unemployment |
| Immigrants | Nepal | 99.8 /100 | #32 | Exceptional 4.8% |
| Latvians | 99.7 /100 | #33 | Exceptional 4.8% |
| Welsh | 99.7 /100 | #34 | Exceptional 4.8% |
| Paraguayans | 99.5 /100 | #35 | Exceptional 4.9% |
| Immigrants | Singapore | 99.4 /100 | #36 | Exceptional 4.9% |
| Scotch-Irish | 99.4 /100 | #37 | Exceptional 4.9% |
| Immigrants | Bosnia and Herzegovina | 99.4 /100 | #38 | Exceptional 4.9% |
| Burmese | 99.3 /100 | #39 | Exceptional 4.9% |
| Northern Europeans | 99.3 /100 | #40 | Exceptional 4.9% |
| Chinese | 99.3 /100 | #41 | Exceptional 4.9% |
| Immigrants | Belgium | 99.2 /100 | #42 | Exceptional 4.9% |
| Immigrants | Japan | 99.2 /100 | #43 | Exceptional 4.9% |
| Immigrants | Korea | 99.1 /100 | #44 | Exceptional 4.9% |
| Immigrants | Zimbabwe | 99.0 /100 | #45 | Exceptional 4.9% |
| Bhutanese | 98.9 /100 | #46 | Exceptional 4.9% |
| Austrians | 98.9 /100 | #47 | Exceptional 4.9% |
| Immigrants | Scotland | 98.9 /100 | #48 | Exceptional 4.9% |
| Poles | 98.9 /100 | #49 | Exceptional 4.9% |
| Croatians | 98.9 /100 | #50 | Exceptional 4.9% |
| Slovenes | 98.8 /100 | #51 | Exceptional 5.0% |
| Irish | 98.8 /100 | #52 | Exceptional 5.0% |