Immigrants from Nepal vs Immigrants from Ukraine Median Earnings
COMPARE
Immigrants from Nepal
Immigrants from Ukraine
Median Earnings
Median Earnings Comparison
Immigrants from Nepal
Immigrants from Ukraine
$47,925
MEDIAN EARNINGS
89.0/ 100
METRIC RATING
137th/ 347
METRIC RANK
$50,984
MEDIAN EARNINGS
99.8/ 100
METRIC RATING
71st/ 347
METRIC RANK
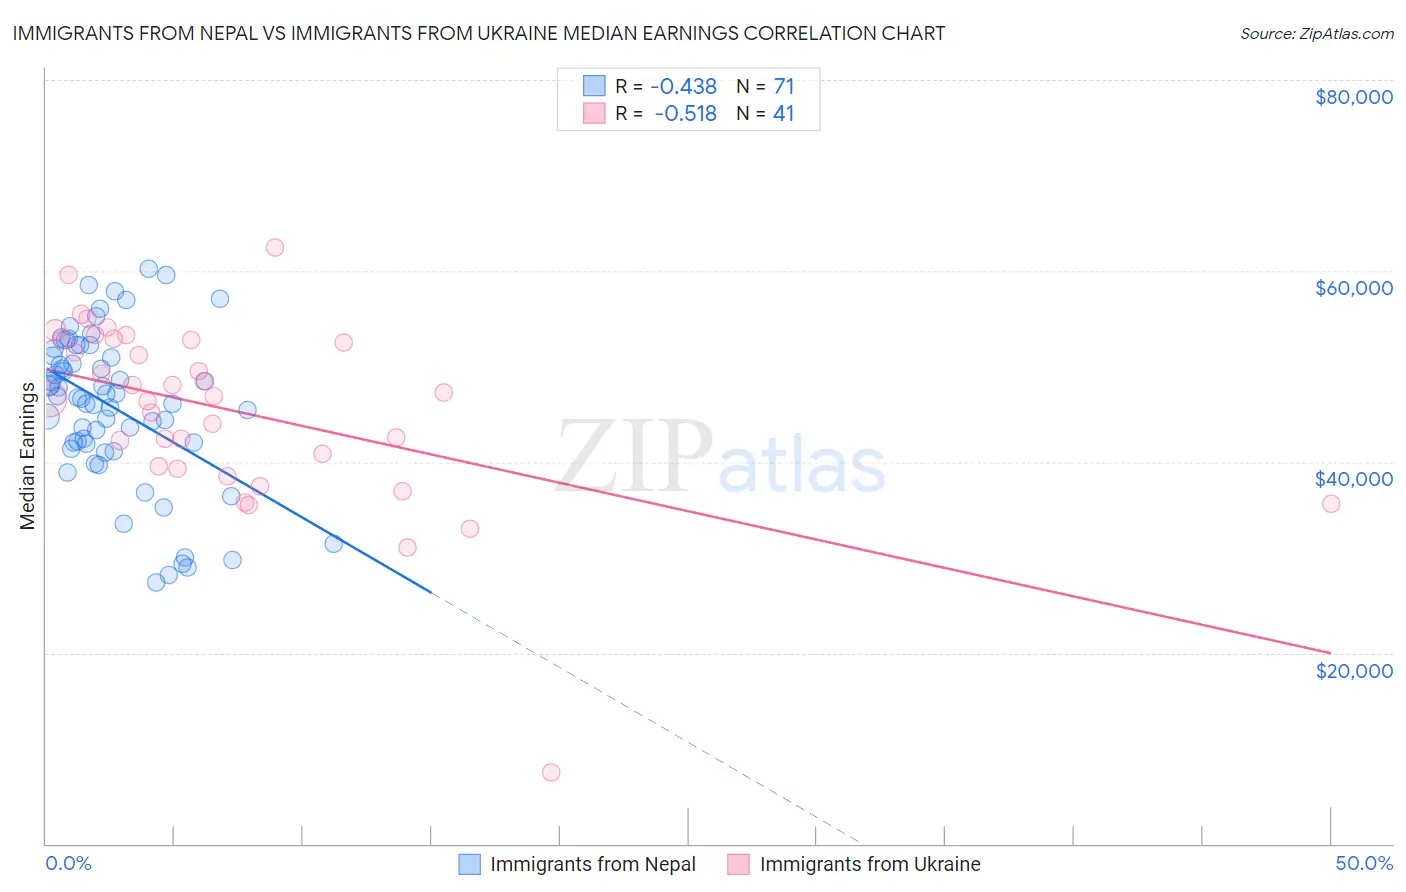
Immigrants from Nepal vs Immigrants from Ukraine Median Earnings Correlation Chart
The statistical analysis conducted on geographies consisting of 186,786,511 people shows a moderate negative correlation between the proportion of Immigrants from Nepal and median earnings in the United States with a correlation coefficient (R) of -0.438 and weighted average of $47,925. Similarly, the statistical analysis conducted on geographies consisting of 289,705,710 people shows a substantial negative correlation between the proportion of Immigrants from Ukraine and median earnings in the United States with a correlation coefficient (R) of -0.518 and weighted average of $50,984, a difference of 6.4%.
Median Earnings Correlation Summary
| Measurement | Immigrants from Nepal | Immigrants from Ukraine |
| Minimum | $27,307 | $7,500 |
| Maximum | $60,227 | $62,500 |
| Range | $32,920 | $55,000 |
| Mean | $45,713 | $45,386 |
| Median | $46,771 | $46,915 |
| Interquartile 25% (IQ1) | $41,930 | $39,380 |
| Interquartile 75% (IQ3) | $51,099 | $52,800 |
| Interquartile Range (IQR) | $9,169 | $13,420 |
| Standard Deviation (Sample) | $7,950 | $9,626 |
| Standard Deviation (Population) | $7,894 | $9,508 |
Similar Demographics by Median Earnings
Demographics Similar to Immigrants from Nepal by Median Earnings
In terms of median earnings, the demographic groups most similar to Immigrants from Nepal are European ($47,915, a difference of 0.020%), Canadian ($47,911, a difference of 0.030%), Taiwanese ($47,902, a difference of 0.050%), Immigrants from Sierra Leone ($47,875, a difference of 0.11%), and Slovene ($47,995, a difference of 0.15%).
| Demographics | Rating | Rank | Median Earnings |
| Zimbabweans | 92.6 /100 | #130 | Exceptional $48,229 |
| Lebanese | 92.5 /100 | #131 | Exceptional $48,226 |
| British | 92.2 /100 | #132 | Exceptional $48,189 |
| Immigrants | Uganda | 90.5 /100 | #133 | Exceptional $48,041 |
| Sri Lankans | 90.5 /100 | #134 | Exceptional $48,040 |
| Portuguese | 90.4 /100 | #135 | Exceptional $48,032 |
| Slovenes | 90.0 /100 | #136 | Excellent $47,995 |
| Immigrants | Nepal | 89.0 /100 | #137 | Excellent $47,925 |
| Europeans | 88.9 /100 | #138 | Excellent $47,915 |
| Canadians | 88.8 /100 | #139 | Excellent $47,911 |
| Taiwanese | 88.7 /100 | #140 | Excellent $47,902 |
| Immigrants | Sierra Leone | 88.3 /100 | #141 | Excellent $47,875 |
| Ugandans | 88.0 /100 | #142 | Excellent $47,854 |
| Swedes | 88.0 /100 | #143 | Excellent $47,851 |
| Hungarians | 87.1 /100 | #144 | Excellent $47,795 |
Demographics Similar to Immigrants from Ukraine by Median Earnings
In terms of median earnings, the demographic groups most similar to Immigrants from Ukraine are Lithuanian ($50,991, a difference of 0.010%), Mongolian ($51,038, a difference of 0.10%), Paraguayan ($51,068, a difference of 0.16%), Immigrants from Egypt ($50,901, a difference of 0.16%), and Immigrants from Spain ($51,092, a difference of 0.21%).
| Demographics | Rating | Rank | Median Earnings |
| New Zealanders | 99.9 /100 | #64 | Exceptional $51,246 |
| Greeks | 99.9 /100 | #65 | Exceptional $51,164 |
| Afghans | 99.9 /100 | #66 | Exceptional $51,112 |
| Immigrants | Spain | 99.9 /100 | #67 | Exceptional $51,092 |
| Paraguayans | 99.9 /100 | #68 | Exceptional $51,068 |
| Mongolians | 99.8 /100 | #69 | Exceptional $51,038 |
| Lithuanians | 99.8 /100 | #70 | Exceptional $50,991 |
| Immigrants | Ukraine | 99.8 /100 | #71 | Exceptional $50,984 |
| Immigrants | Egypt | 99.8 /100 | #72 | Exceptional $50,901 |
| Immigrants | Netherlands | 99.8 /100 | #73 | Exceptional $50,818 |
| South Africans | 99.8 /100 | #74 | Exceptional $50,752 |
| Immigrants | Scotland | 99.8 /100 | #75 | Exceptional $50,741 |
| Immigrants | Italy | 99.7 /100 | #76 | Exceptional $50,581 |
| Immigrants | Western Europe | 99.7 /100 | #77 | Exceptional $50,549 |
| Argentineans | 99.6 /100 | #78 | Exceptional $50,399 |