Immigrants from Mexico vs Immigrants from North Macedonia Householder Income Ages 45 - 64 years
COMPARE
Immigrants from Mexico
Immigrants from North Macedonia
Householder Income Ages 45 - 64 years
Householder Income Ages 45 - 64 years Comparison
Immigrants from Mexico
Immigrants from North Macedonia
$84,910
HOUSEHOLDER INCOME AGES 45 - 64 YEARS
0.0/ 100
METRIC RATING
299th/ 347
METRIC RANK
$105,892
HOUSEHOLDER INCOME AGES 45 - 64 YEARS
94.2/ 100
METRIC RATING
122nd/ 347
METRIC RANK
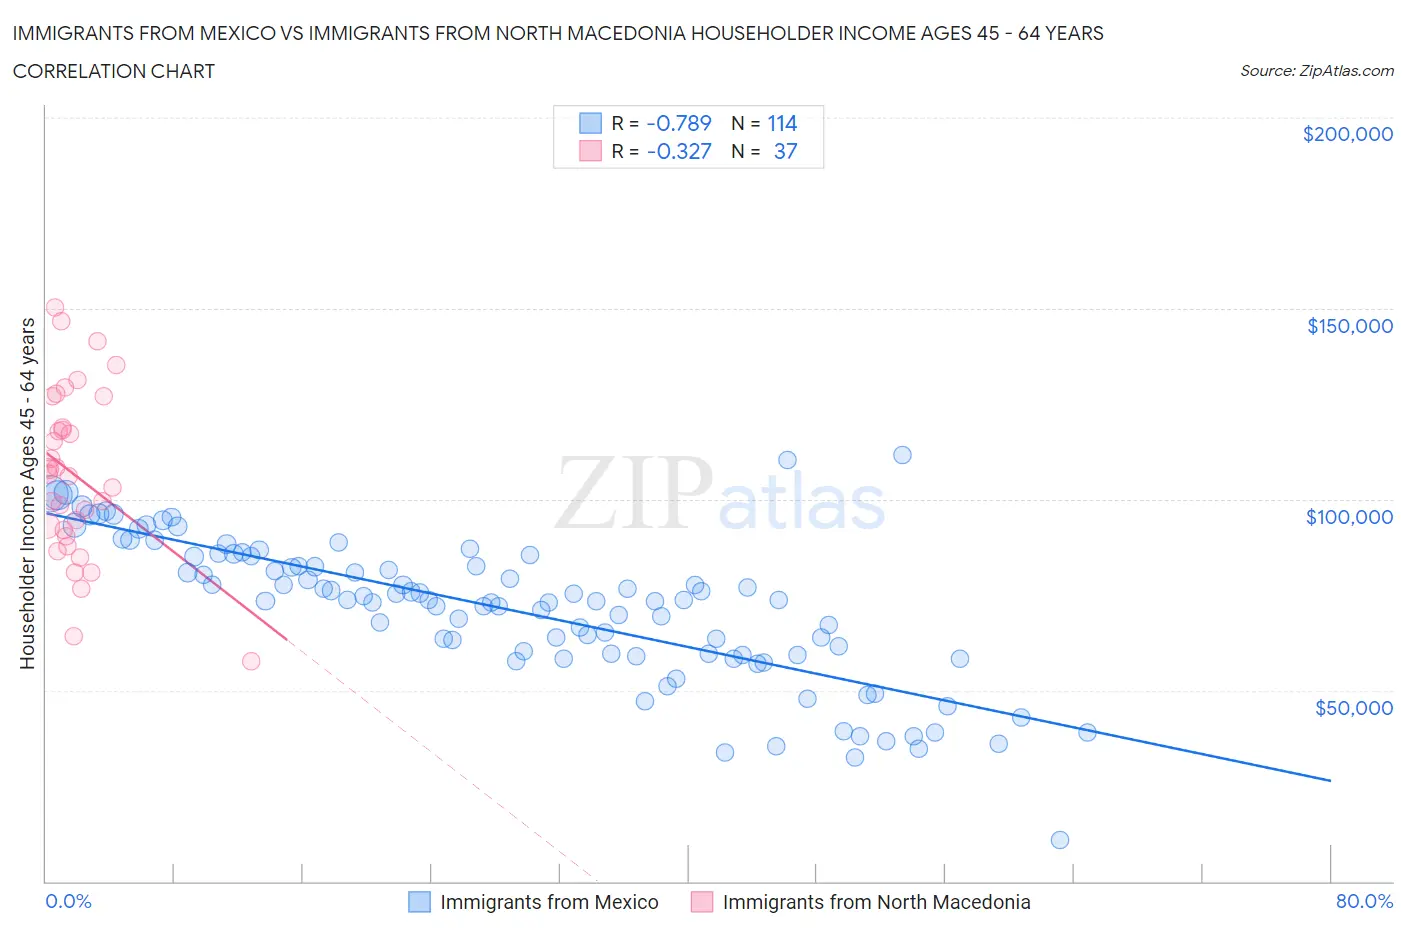
Immigrants from Mexico vs Immigrants from North Macedonia Householder Income Ages 45 - 64 years Correlation Chart
The statistical analysis conducted on geographies consisting of 511,517,023 people shows a strong negative correlation between the proportion of Immigrants from Mexico and household income with householder between the ages 45 and 64 in the United States with a correlation coefficient (R) of -0.789 and weighted average of $84,910. Similarly, the statistical analysis conducted on geographies consisting of 74,276,475 people shows a mild negative correlation between the proportion of Immigrants from North Macedonia and household income with householder between the ages 45 and 64 in the United States with a correlation coefficient (R) of -0.327 and weighted average of $105,892, a difference of 24.7%.
Householder Income Ages 45 - 64 years Correlation Summary
| Measurement | Immigrants from Mexico | Immigrants from North Macedonia |
| Minimum | $10,788 | $57,692 |
| Maximum | $111,667 | $150,188 |
| Range | $100,879 | $92,496 |
| Mean | $71,096 | $106,443 |
| Median | $73,588 | $106,642 |
| Interquartile 25% (IQ1) | $59,284 | $91,237 |
| Interquartile 75% (IQ3) | $85,004 | $122,928 |
| Interquartile Range (IQR) | $25,720 | $31,692 |
| Standard Deviation (Sample) | $18,984 | $21,888 |
| Standard Deviation (Population) | $18,900 | $21,590 |
Similar Demographics by Householder Income Ages 45 - 64 years
Demographics Similar to Immigrants from Mexico by Householder Income Ages 45 - 64 years
In terms of householder income ages 45 - 64 years, the demographic groups most similar to Immigrants from Mexico are African ($84,925, a difference of 0.020%), Indonesian ($84,890, a difference of 0.020%), Fijian ($85,187, a difference of 0.33%), Immigrants from Zaire ($85,207, a difference of 0.35%), and Potawatomi ($84,613, a difference of 0.35%).
| Demographics | Rating | Rank | Householder Income Ages 45 - 64 years |
| Immigrants | Central America | 0.1 /100 | #292 | Tragic $85,965 |
| Comanche | 0.1 /100 | #293 | Tragic $85,787 |
| British West Indians | 0.1 /100 | #294 | Tragic $85,571 |
| Immigrants | Grenada | 0.1 /100 | #295 | Tragic $85,552 |
| Immigrants | Zaire | 0.1 /100 | #296 | Tragic $85,207 |
| Fijians | 0.1 /100 | #297 | Tragic $85,187 |
| Africans | 0.0 /100 | #298 | Tragic $84,925 |
| Immigrants | Mexico | 0.0 /100 | #299 | Tragic $84,910 |
| Indonesians | 0.0 /100 | #300 | Tragic $84,890 |
| Potawatomi | 0.0 /100 | #301 | Tragic $84,613 |
| Haitians | 0.0 /100 | #302 | Tragic $84,384 |
| Hondurans | 0.0 /100 | #303 | Tragic $84,079 |
| Ottawa | 0.0 /100 | #304 | Tragic $83,953 |
| Chippewa | 0.0 /100 | #305 | Tragic $83,943 |
| Ute | 0.0 /100 | #306 | Tragic $83,937 |
Demographics Similar to Immigrants from North Macedonia by Householder Income Ages 45 - 64 years
In terms of householder income ages 45 - 64 years, the demographic groups most similar to Immigrants from North Macedonia are Polish ($105,952, a difference of 0.060%), Immigrants from South Eastern Asia ($106,109, a difference of 0.20%), Immigrants from Jordan ($106,164, a difference of 0.26%), Danish ($105,619, a difference of 0.26%), and Immigrants from Western Asia ($106,217, a difference of 0.31%).
| Demographics | Rating | Rank | Householder Income Ages 45 - 64 years |
| Immigrants | Kuwait | 95.2 /100 | #115 | Exceptional $106,285 |
| British | 95.2 /100 | #116 | Exceptional $106,264 |
| Albanians | 95.1 /100 | #117 | Exceptional $106,243 |
| Immigrants | Western Asia | 95.0 /100 | #118 | Exceptional $106,217 |
| Immigrants | Jordan | 94.9 /100 | #119 | Exceptional $106,164 |
| Immigrants | South Eastern Asia | 94.8 /100 | #120 | Exceptional $106,109 |
| Poles | 94.4 /100 | #121 | Exceptional $105,952 |
| Immigrants | North Macedonia | 94.2 /100 | #122 | Exceptional $105,892 |
| Danes | 93.4 /100 | #123 | Exceptional $105,619 |
| Immigrants | Northern Africa | 92.8 /100 | #124 | Exceptional $105,430 |
| Pakistanis | 92.4 /100 | #125 | Exceptional $105,317 |
| Portuguese | 92.4 /100 | #126 | Exceptional $105,309 |
| Immigrants | Saudi Arabia | 92.2 /100 | #127 | Exceptional $105,249 |
| Native Hawaiians | 91.8 /100 | #128 | Exceptional $105,149 |
| Peruvians | 91.5 /100 | #129 | Exceptional $105,070 |