Immigrants from Mexico vs Palestinian Householder Income Ages 45 - 64 years
COMPARE
Immigrants from Mexico
Palestinian
Householder Income Ages 45 - 64 years
Householder Income Ages 45 - 64 years Comparison
Immigrants from Mexico
Palestinians
$84,910
HOUSEHOLDER INCOME AGES 45 - 64 YEARS
0.0/ 100
METRIC RATING
299th/ 347
METRIC RANK
$107,721
HOUSEHOLDER INCOME AGES 45 - 64 YEARS
97.6/ 100
METRIC RATING
99th/ 347
METRIC RANK
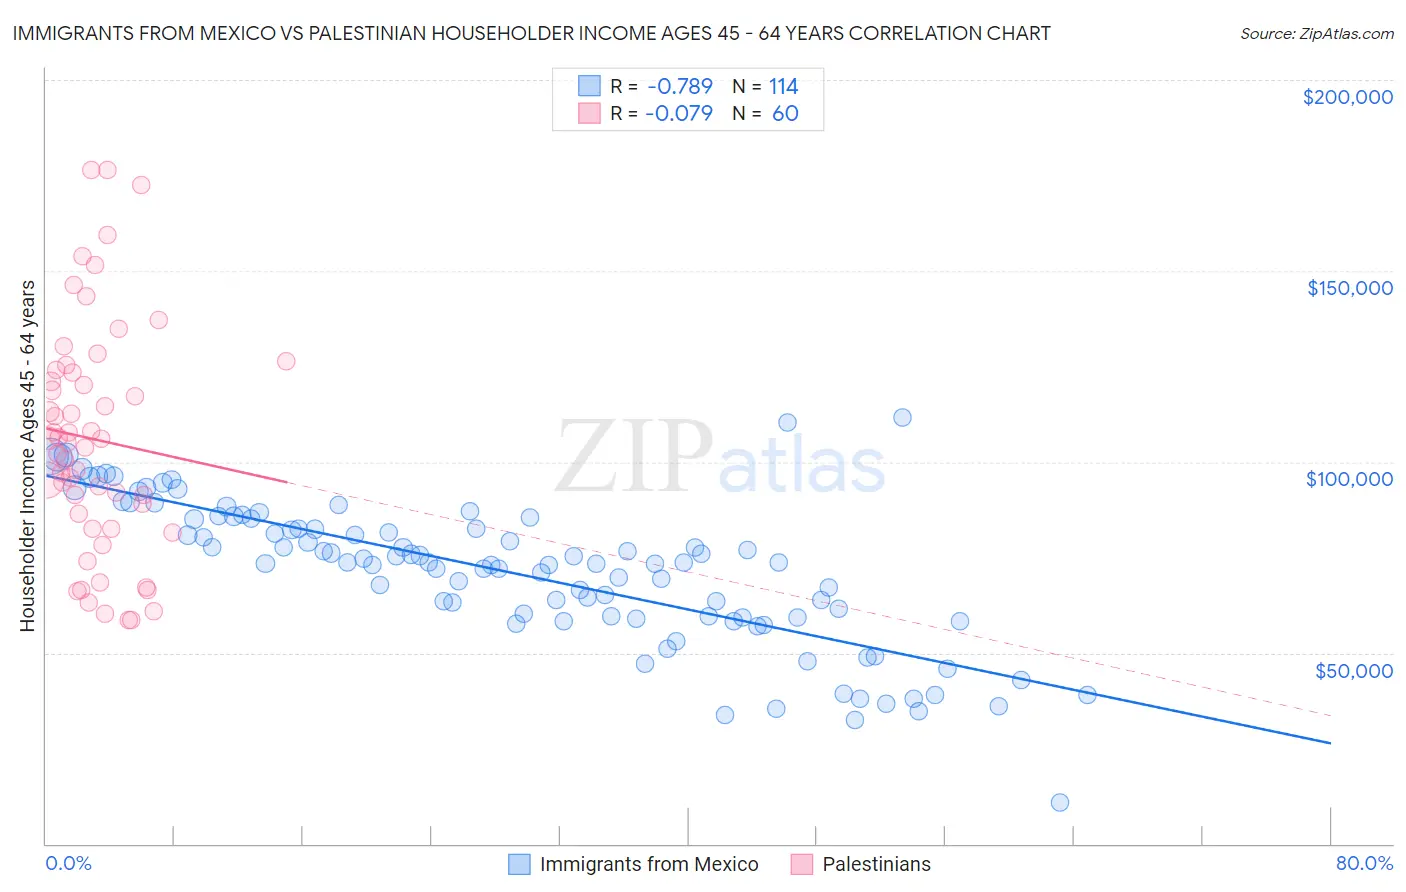
Immigrants from Mexico vs Palestinian Householder Income Ages 45 - 64 years Correlation Chart
The statistical analysis conducted on geographies consisting of 511,517,023 people shows a strong negative correlation between the proportion of Immigrants from Mexico and household income with householder between the ages 45 and 64 in the United States with a correlation coefficient (R) of -0.789 and weighted average of $84,910. Similarly, the statistical analysis conducted on geographies consisting of 216,304,002 people shows a slight negative correlation between the proportion of Palestinians and household income with householder between the ages 45 and 64 in the United States with a correlation coefficient (R) of -0.079 and weighted average of $107,721, a difference of 26.9%.
Householder Income Ages 45 - 64 years Correlation Summary
| Measurement | Immigrants from Mexico | Palestinian |
| Minimum | $10,788 | $58,671 |
| Maximum | $111,667 | $176,545 |
| Range | $100,879 | $117,874 |
| Mean | $71,096 | $105,880 |
| Median | $73,588 | $105,547 |
| Interquartile 25% (IQ1) | $59,284 | $84,446 |
| Interquartile 75% (IQ3) | $85,004 | $123,759 |
| Interquartile Range (IQR) | $25,720 | $39,313 |
| Standard Deviation (Sample) | $18,984 | $30,088 |
| Standard Deviation (Population) | $18,900 | $29,836 |
Similar Demographics by Householder Income Ages 45 - 64 years
Demographics Similar to Immigrants from Mexico by Householder Income Ages 45 - 64 years
In terms of householder income ages 45 - 64 years, the demographic groups most similar to Immigrants from Mexico are African ($84,925, a difference of 0.020%), Indonesian ($84,890, a difference of 0.020%), Fijian ($85,187, a difference of 0.33%), Immigrants from Zaire ($85,207, a difference of 0.35%), and Potawatomi ($84,613, a difference of 0.35%).
| Demographics | Rating | Rank | Householder Income Ages 45 - 64 years |
| Immigrants | Central America | 0.1 /100 | #292 | Tragic $85,965 |
| Comanche | 0.1 /100 | #293 | Tragic $85,787 |
| British West Indians | 0.1 /100 | #294 | Tragic $85,571 |
| Immigrants | Grenada | 0.1 /100 | #295 | Tragic $85,552 |
| Immigrants | Zaire | 0.1 /100 | #296 | Tragic $85,207 |
| Fijians | 0.1 /100 | #297 | Tragic $85,187 |
| Africans | 0.0 /100 | #298 | Tragic $84,925 |
| Immigrants | Mexico | 0.0 /100 | #299 | Tragic $84,910 |
| Indonesians | 0.0 /100 | #300 | Tragic $84,890 |
| Potawatomi | 0.0 /100 | #301 | Tragic $84,613 |
| Haitians | 0.0 /100 | #302 | Tragic $84,384 |
| Hondurans | 0.0 /100 | #303 | Tragic $84,079 |
| Ottawa | 0.0 /100 | #304 | Tragic $83,953 |
| Chippewa | 0.0 /100 | #305 | Tragic $83,943 |
| Ute | 0.0 /100 | #306 | Tragic $83,937 |
Demographics Similar to Palestinians by Householder Income Ages 45 - 64 years
In terms of householder income ages 45 - 64 years, the demographic groups most similar to Palestinians are Immigrants from Southern Europe ($107,775, a difference of 0.050%), Northern European ($107,870, a difference of 0.14%), Immigrants from Serbia ($107,569, a difference of 0.14%), Immigrants from Kazakhstan ($107,378, a difference of 0.32%), and Immigrants from Moldova ($107,357, a difference of 0.34%).
| Demographics | Rating | Rank | Householder Income Ages 45 - 64 years |
| Croatians | 98.3 /100 | #92 | Exceptional $108,383 |
| Immigrants | Croatia | 98.2 /100 | #93 | Exceptional $108,304 |
| Sri Lankans | 98.2 /100 | #94 | Exceptional $108,270 |
| Immigrants | Hungary | 98.2 /100 | #95 | Exceptional $108,267 |
| Immigrants | Argentina | 98.2 /100 | #96 | Exceptional $108,264 |
| Northern Europeans | 97.8 /100 | #97 | Exceptional $107,870 |
| Immigrants | Southern Europe | 97.7 /100 | #98 | Exceptional $107,775 |
| Palestinians | 97.6 /100 | #99 | Exceptional $107,721 |
| Immigrants | Serbia | 97.4 /100 | #100 | Exceptional $107,569 |
| Immigrants | Kazakhstan | 97.2 /100 | #101 | Exceptional $107,378 |
| Immigrants | Moldova | 97.1 /100 | #102 | Exceptional $107,357 |
| Syrians | 96.9 /100 | #103 | Exceptional $107,207 |
| Immigrants | Ukraine | 96.7 /100 | #104 | Exceptional $107,079 |
| Macedonians | 96.7 /100 | #105 | Exceptional $107,074 |
| Armenians | 96.6 /100 | #106 | Exceptional $107,002 |