Immigrants from Somalia vs Chickasaw Householder Income Ages 45 - 64 years
COMPARE
Immigrants from Somalia
Chickasaw
Householder Income Ages 45 - 64 years
Householder Income Ages 45 - 64 years Comparison
Immigrants from Somalia
Chickasaw
$86,987
HOUSEHOLDER INCOME AGES 45 - 64 YEARS
0.1/ 100
METRIC RATING
280th/ 347
METRIC RANK
$82,193
HOUSEHOLDER INCOME AGES 45 - 64 YEARS
0.0/ 100
METRIC RATING
319th/ 347
METRIC RANK
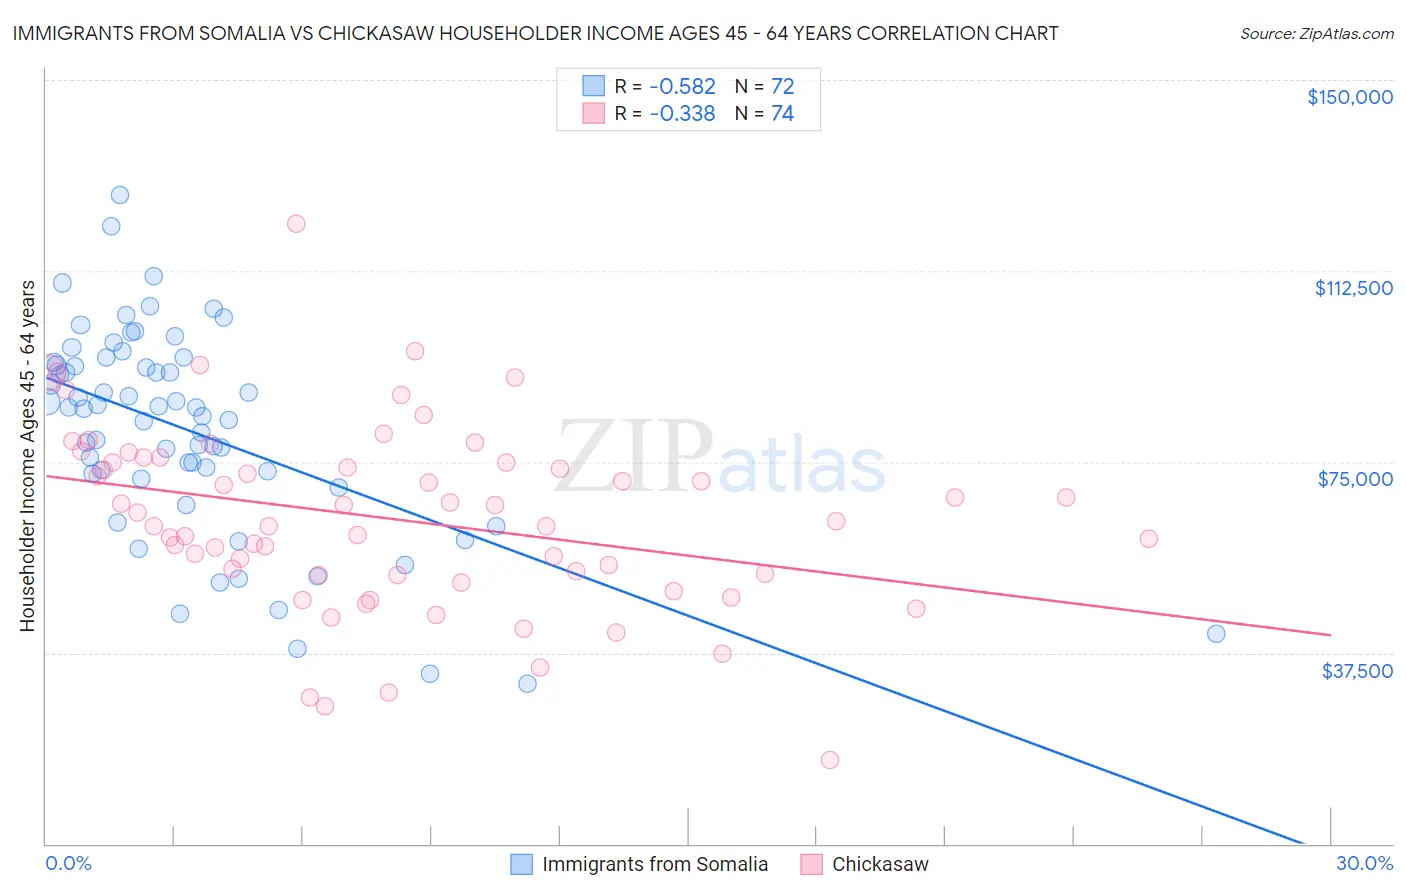
Immigrants from Somalia vs Chickasaw Householder Income Ages 45 - 64 years Correlation Chart
The statistical analysis conducted on geographies consisting of 92,059,302 people shows a substantial negative correlation between the proportion of Immigrants from Somalia and household income with householder between the ages 45 and 64 in the United States with a correlation coefficient (R) of -0.582 and weighted average of $86,987. Similarly, the statistical analysis conducted on geographies consisting of 147,555,811 people shows a mild negative correlation between the proportion of Chickasaw and household income with householder between the ages 45 and 64 in the United States with a correlation coefficient (R) of -0.338 and weighted average of $82,193, a difference of 5.8%.
Householder Income Ages 45 - 64 years Correlation Summary
| Measurement | Immigrants from Somalia | Chickasaw |
| Minimum | $31,458 | $16,544 |
| Maximum | $127,433 | $121,667 |
| Range | $95,975 | $105,123 |
| Mean | $81,140 | $63,806 |
| Median | $85,605 | $62,897 |
| Interquartile 25% (IQ1) | $72,230 | $52,874 |
| Interquartile 75% (IQ3) | $94,234 | $75,000 |
| Interquartile Range (IQR) | $22,004 | $22,126 |
| Standard Deviation (Sample) | $20,209 | $18,170 |
| Standard Deviation (Population) | $20,068 | $18,046 |
Similar Demographics by Householder Income Ages 45 - 64 years
Demographics Similar to Immigrants from Somalia by Householder Income Ages 45 - 64 years
In terms of householder income ages 45 - 64 years, the demographic groups most similar to Immigrants from Somalia are Yakama ($86,992, a difference of 0.010%), Immigrants from Jamaica ($87,035, a difference of 0.050%), Yaqui ($86,914, a difference of 0.080%), Senegalese ($86,897, a difference of 0.10%), and Mexican ($86,816, a difference of 0.20%).
| Demographics | Rating | Rank | Householder Income Ages 45 - 64 years |
| Spanish American Indians | 0.2 /100 | #273 | Tragic $87,561 |
| Iroquois | 0.1 /100 | #274 | Tragic $87,255 |
| Immigrants | Belize | 0.1 /100 | #275 | Tragic $87,229 |
| Immigrants | Latin America | 0.1 /100 | #276 | Tragic $87,219 |
| Cree | 0.1 /100 | #277 | Tragic $87,185 |
| Immigrants | Jamaica | 0.1 /100 | #278 | Tragic $87,035 |
| Yakama | 0.1 /100 | #279 | Tragic $86,992 |
| Immigrants | Somalia | 0.1 /100 | #280 | Tragic $86,987 |
| Yaqui | 0.1 /100 | #281 | Tragic $86,914 |
| Senegalese | 0.1 /100 | #282 | Tragic $86,897 |
| Mexicans | 0.1 /100 | #283 | Tragic $86,816 |
| Central American Indians | 0.1 /100 | #284 | Tragic $86,764 |
| Blackfeet | 0.1 /100 | #285 | Tragic $86,595 |
| Immigrants | Guatemala | 0.1 /100 | #286 | Tragic $86,573 |
| Bangladeshis | 0.1 /100 | #287 | Tragic $86,402 |
Demographics Similar to Chickasaw by Householder Income Ages 45 - 64 years
In terms of householder income ages 45 - 64 years, the demographic groups most similar to Chickasaw are Apache ($82,184, a difference of 0.010%), Yuman ($82,139, a difference of 0.070%), Choctaw ($82,287, a difference of 0.11%), Colville ($82,474, a difference of 0.34%), and Immigrants from Caribbean ($82,513, a difference of 0.39%).
| Demographics | Rating | Rank | Householder Income Ages 45 - 64 years |
| Cajuns | 0.0 /100 | #312 | Tragic $83,015 |
| U.S. Virgin Islanders | 0.0 /100 | #313 | Tragic $82,736 |
| Immigrants | Honduras | 0.0 /100 | #314 | Tragic $82,697 |
| Paiute | 0.0 /100 | #315 | Tragic $82,629 |
| Immigrants | Caribbean | 0.0 /100 | #316 | Tragic $82,513 |
| Colville | 0.0 /100 | #317 | Tragic $82,474 |
| Choctaw | 0.0 /100 | #318 | Tragic $82,287 |
| Chickasaw | 0.0 /100 | #319 | Tragic $82,193 |
| Apache | 0.0 /100 | #320 | Tragic $82,184 |
| Yuman | 0.0 /100 | #321 | Tragic $82,139 |
| Sioux | 0.0 /100 | #322 | Tragic $81,750 |
| Bahamians | 0.0 /100 | #323 | Tragic $81,369 |
| Yup'ik | 0.0 /100 | #324 | Tragic $81,000 |
| Immigrants | Cuba | 0.0 /100 | #325 | Tragic $80,662 |
| Dominicans | 0.0 /100 | #326 | Tragic $80,623 |