Immigrants from Mexico vs Jamaican Householder Income Ages 45 - 64 years
COMPARE
Immigrants from Mexico
Jamaican
Householder Income Ages 45 - 64 years
Householder Income Ages 45 - 64 years Comparison
Immigrants from Mexico
Jamaicans
$84,910
HOUSEHOLDER INCOME AGES 45 - 64 YEARS
0.0/ 100
METRIC RATING
299th/ 347
METRIC RANK
$88,327
HOUSEHOLDER INCOME AGES 45 - 64 YEARS
0.2/ 100
METRIC RATING
265th/ 347
METRIC RANK
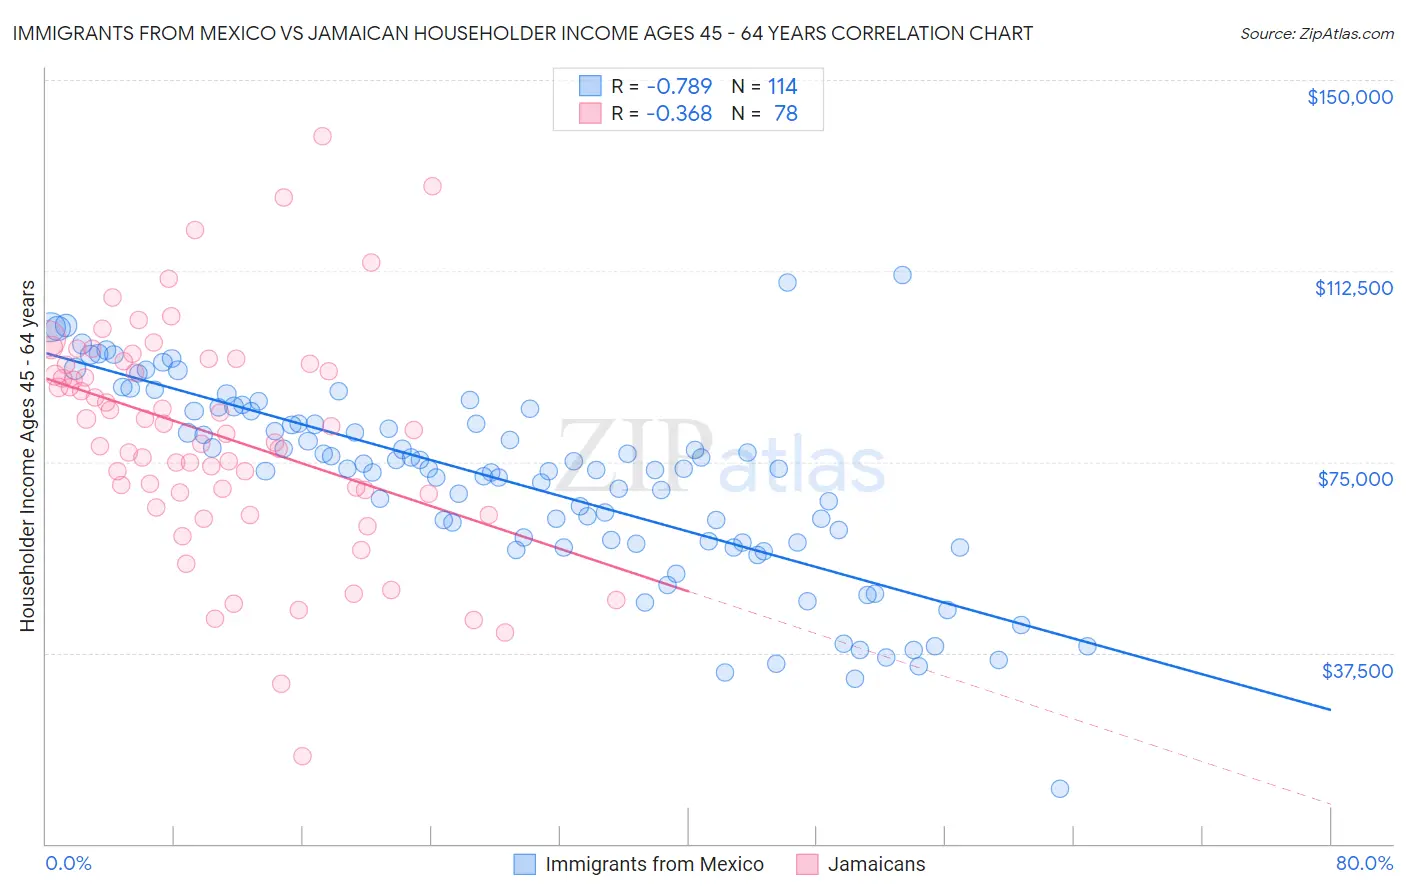
Immigrants from Mexico vs Jamaican Householder Income Ages 45 - 64 years Correlation Chart
The statistical analysis conducted on geographies consisting of 511,517,023 people shows a strong negative correlation between the proportion of Immigrants from Mexico and household income with householder between the ages 45 and 64 in the United States with a correlation coefficient (R) of -0.789 and weighted average of $84,910. Similarly, the statistical analysis conducted on geographies consisting of 367,130,197 people shows a mild negative correlation between the proportion of Jamaicans and household income with householder between the ages 45 and 64 in the United States with a correlation coefficient (R) of -0.368 and weighted average of $88,327, a difference of 4.0%.
Householder Income Ages 45 - 64 years Correlation Summary
| Measurement | Immigrants from Mexico | Jamaican |
| Minimum | $10,788 | $17,167 |
| Maximum | $111,667 | $139,000 |
| Range | $100,879 | $121,833 |
| Mean | $71,096 | $80,364 |
| Median | $73,588 | $81,673 |
| Interquartile 25% (IQ1) | $59,284 | $68,925 |
| Interquartile 75% (IQ3) | $85,004 | $94,316 |
| Interquartile Range (IQR) | $25,720 | $25,392 |
| Standard Deviation (Sample) | $18,984 | $22,119 |
| Standard Deviation (Population) | $18,900 | $21,977 |
Similar Demographics by Householder Income Ages 45 - 64 years
Demographics Similar to Immigrants from Mexico by Householder Income Ages 45 - 64 years
In terms of householder income ages 45 - 64 years, the demographic groups most similar to Immigrants from Mexico are African ($84,925, a difference of 0.020%), Indonesian ($84,890, a difference of 0.020%), Fijian ($85,187, a difference of 0.33%), Immigrants from Zaire ($85,207, a difference of 0.35%), and Potawatomi ($84,613, a difference of 0.35%).
| Demographics | Rating | Rank | Householder Income Ages 45 - 64 years |
| Immigrants | Central America | 0.1 /100 | #292 | Tragic $85,965 |
| Comanche | 0.1 /100 | #293 | Tragic $85,787 |
| British West Indians | 0.1 /100 | #294 | Tragic $85,571 |
| Immigrants | Grenada | 0.1 /100 | #295 | Tragic $85,552 |
| Immigrants | Zaire | 0.1 /100 | #296 | Tragic $85,207 |
| Fijians | 0.1 /100 | #297 | Tragic $85,187 |
| Africans | 0.0 /100 | #298 | Tragic $84,925 |
| Immigrants | Mexico | 0.0 /100 | #299 | Tragic $84,910 |
| Indonesians | 0.0 /100 | #300 | Tragic $84,890 |
| Potawatomi | 0.0 /100 | #301 | Tragic $84,613 |
| Haitians | 0.0 /100 | #302 | Tragic $84,384 |
| Hondurans | 0.0 /100 | #303 | Tragic $84,079 |
| Ottawa | 0.0 /100 | #304 | Tragic $83,953 |
| Chippewa | 0.0 /100 | #305 | Tragic $83,943 |
| Ute | 0.0 /100 | #306 | Tragic $83,937 |
Demographics Similar to Jamaicans by Householder Income Ages 45 - 64 years
In terms of householder income ages 45 - 64 years, the demographic groups most similar to Jamaicans are Osage ($88,390, a difference of 0.070%), Immigrants from Senegal ($88,421, a difference of 0.11%), Immigrants from West Indies ($88,164, a difference of 0.19%), Hmong ($88,115, a difference of 0.24%), and Somali ($88,600, a difference of 0.31%).
| Demographics | Rating | Rank | Householder Income Ages 45 - 64 years |
| Immigrants | Barbados | 0.4 /100 | #258 | Tragic $89,394 |
| Immigrants | Nicaragua | 0.4 /100 | #259 | Tragic $89,108 |
| Liberians | 0.3 /100 | #260 | Tragic $88,929 |
| Belizeans | 0.3 /100 | #261 | Tragic $88,684 |
| Somalis | 0.3 /100 | #262 | Tragic $88,600 |
| Immigrants | Senegal | 0.3 /100 | #263 | Tragic $88,421 |
| Osage | 0.3 /100 | #264 | Tragic $88,390 |
| Jamaicans | 0.2 /100 | #265 | Tragic $88,327 |
| Immigrants | West Indies | 0.2 /100 | #266 | Tragic $88,164 |
| Hmong | 0.2 /100 | #267 | Tragic $88,115 |
| Immigrants | Micronesia | 0.2 /100 | #268 | Tragic $87,864 |
| Spanish Americans | 0.2 /100 | #269 | Tragic $87,836 |
| Immigrants | Liberia | 0.2 /100 | #270 | Tragic $87,739 |
| Guatemalans | 0.2 /100 | #271 | Tragic $87,705 |
| Cape Verdeans | 0.2 /100 | #272 | Tragic $87,580 |