Immigrants from Liberia vs Nepalese Median Female Earnings
COMPARE
Immigrants from Liberia
Nepalese
Median Female Earnings
Median Female Earnings Comparison
Immigrants from Liberia
Nepalese
$37,970
MEDIAN FEMALE EARNINGS
2.7/ 100
METRIC RATING
244th/ 347
METRIC RANK
$38,603
MEDIAN FEMALE EARNINGS
9.3/ 100
METRIC RATING
219th/ 347
METRIC RANK
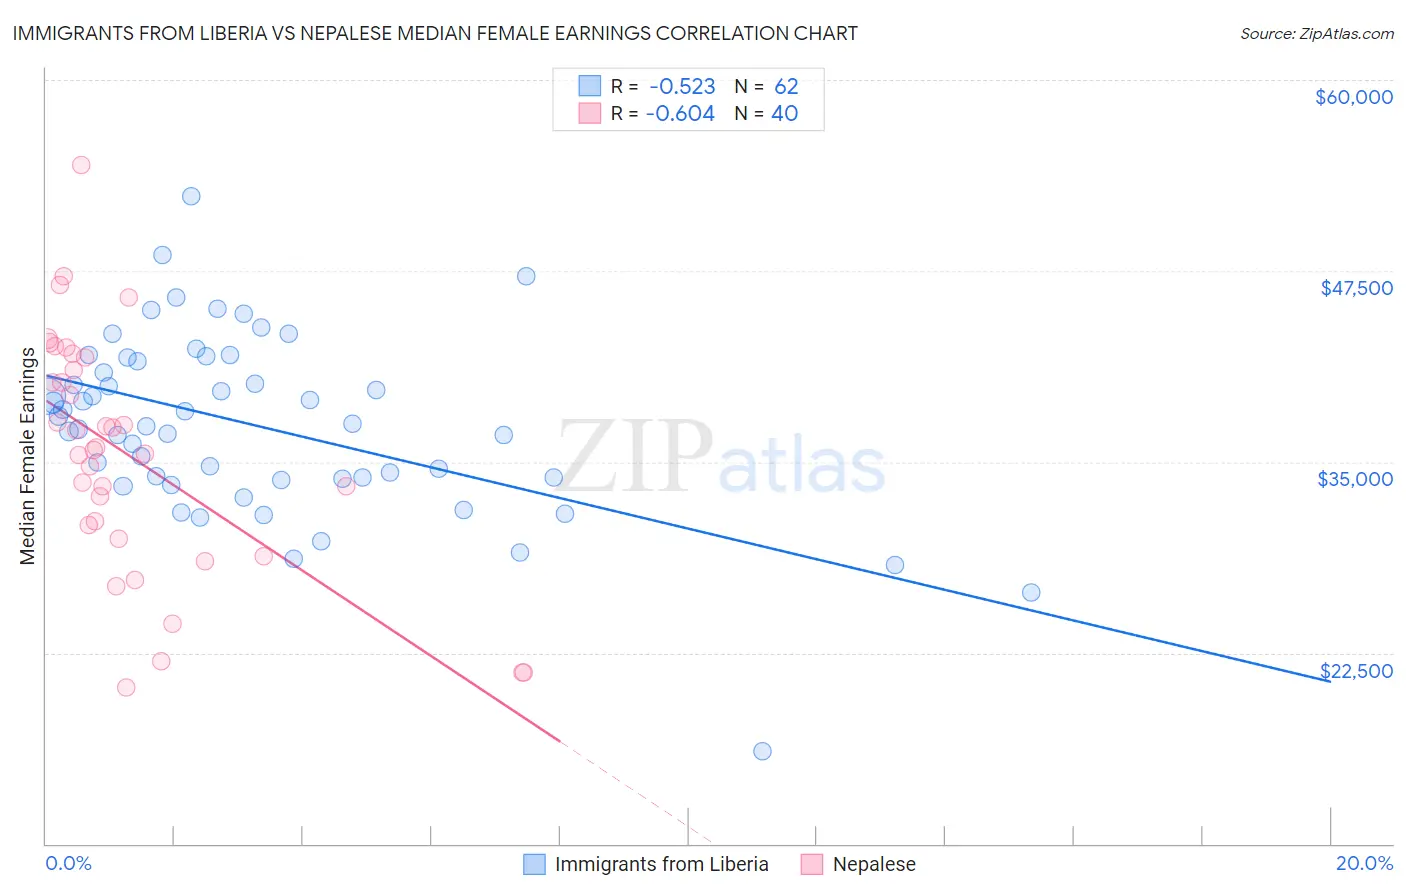
Immigrants from Liberia vs Nepalese Median Female Earnings Correlation Chart
The statistical analysis conducted on geographies consisting of 135,268,038 people shows a substantial negative correlation between the proportion of Immigrants from Liberia and median female earnings in the United States with a correlation coefficient (R) of -0.523 and weighted average of $37,970. Similarly, the statistical analysis conducted on geographies consisting of 24,521,755 people shows a significant negative correlation between the proportion of Nepalese and median female earnings in the United States with a correlation coefficient (R) of -0.604 and weighted average of $38,603, a difference of 1.7%.
Median Female Earnings Correlation Summary
| Measurement | Immigrants from Liberia | Nepalese |
| Minimum | $16,076 | $20,210 |
| Maximum | $52,381 | $54,407 |
| Range | $36,305 | $34,197 |
| Mean | $37,357 | $35,483 |
| Median | $37,425 | $35,860 |
| Interquartile 25% (IQ1) | $33,898 | $30,426 |
| Interquartile 75% (IQ3) | $41,557 | $41,423 |
| Interquartile Range (IQR) | $7,659 | $10,997 |
| Standard Deviation (Sample) | $5,953 | $7,837 |
| Standard Deviation (Population) | $5,904 | $7,738 |
Similar Demographics by Median Female Earnings
Demographics Similar to Immigrants from Liberia by Median Female Earnings
In terms of median female earnings, the demographic groups most similar to Immigrants from Liberia are Immigrants from Middle Africa ($37,965, a difference of 0.010%), Delaware ($37,964, a difference of 0.010%), German ($37,986, a difference of 0.040%), Immigrants from Burma/Myanmar ($38,028, a difference of 0.15%), and Immigrants from Somalia ($37,914, a difference of 0.15%).
| Demographics | Rating | Rank | Median Female Earnings |
| Immigrants | Cabo Verde | 4.3 /100 | #237 | Tragic $38,208 |
| Alaska Natives | 4.3 /100 | #238 | Tragic $38,202 |
| English | 4.2 /100 | #239 | Tragic $38,196 |
| Finns | 4.0 /100 | #240 | Tragic $38,173 |
| Spanish | 3.5 /100 | #241 | Tragic $38,098 |
| Immigrants | Burma/Myanmar | 3.0 /100 | #242 | Tragic $38,028 |
| Germans | 2.8 /100 | #243 | Tragic $37,986 |
| Immigrants | Liberia | 2.7 /100 | #244 | Tragic $37,970 |
| Immigrants | Middle Africa | 2.7 /100 | #245 | Tragic $37,965 |
| Delaware | 2.6 /100 | #246 | Tragic $37,964 |
| Immigrants | Somalia | 2.4 /100 | #247 | Tragic $37,914 |
| Alaskan Athabascans | 2.3 /100 | #248 | Tragic $37,905 |
| Swiss | 2.3 /100 | #249 | Tragic $37,904 |
| Immigrants | Iraq | 2.2 /100 | #250 | Tragic $37,864 |
| Welsh | 2.1 /100 | #251 | Tragic $37,856 |
Demographics Similar to Nepalese by Median Female Earnings
In terms of median female earnings, the demographic groups most similar to Nepalese are Cape Verdean ($38,614, a difference of 0.030%), Immigrants from Jamaica ($38,625, a difference of 0.060%), Yugoslavian ($38,573, a difference of 0.080%), Immigrants from the Azores ($38,573, a difference of 0.080%), and Immigrants from Ecuador ($38,644, a difference of 0.11%).
| Demographics | Rating | Rank | Median Female Earnings |
| Guamanians/Chamorros | 11.5 /100 | #212 | Poor $38,717 |
| Jamaicans | 10.5 /100 | #213 | Poor $38,670 |
| Iraqis | 10.5 /100 | #214 | Poor $38,666 |
| Spaniards | 10.3 /100 | #215 | Poor $38,656 |
| Immigrants | Ecuador | 10.1 /100 | #216 | Poor $38,644 |
| Immigrants | Jamaica | 9.7 /100 | #217 | Tragic $38,625 |
| Cape Verdeans | 9.5 /100 | #218 | Tragic $38,614 |
| Nepalese | 9.3 /100 | #219 | Tragic $38,603 |
| Yugoslavians | 8.8 /100 | #220 | Tragic $38,573 |
| Immigrants | Azores | 8.8 /100 | #221 | Tragic $38,573 |
| Japanese | 8.1 /100 | #222 | Tragic $38,528 |
| Immigrants | Sudan | 7.8 /100 | #223 | Tragic $38,511 |
| Native Hawaiians | 7.1 /100 | #224 | Tragic $38,461 |
| French | 7.0 /100 | #225 | Tragic $38,457 |
| French Canadians | 6.8 /100 | #226 | Tragic $38,436 |