Immigrants from Liberia vs German Russian Median Female Earnings
COMPARE
Immigrants from Liberia
German Russian
Median Female Earnings
Median Female Earnings Comparison
Immigrants from Liberia
German Russians
$37,970
MEDIAN FEMALE EARNINGS
2.7/ 100
METRIC RATING
244th/ 347
METRIC RANK
$37,105
MEDIAN FEMALE EARNINGS
0.5/ 100
METRIC RATING
263rd/ 347
METRIC RANK
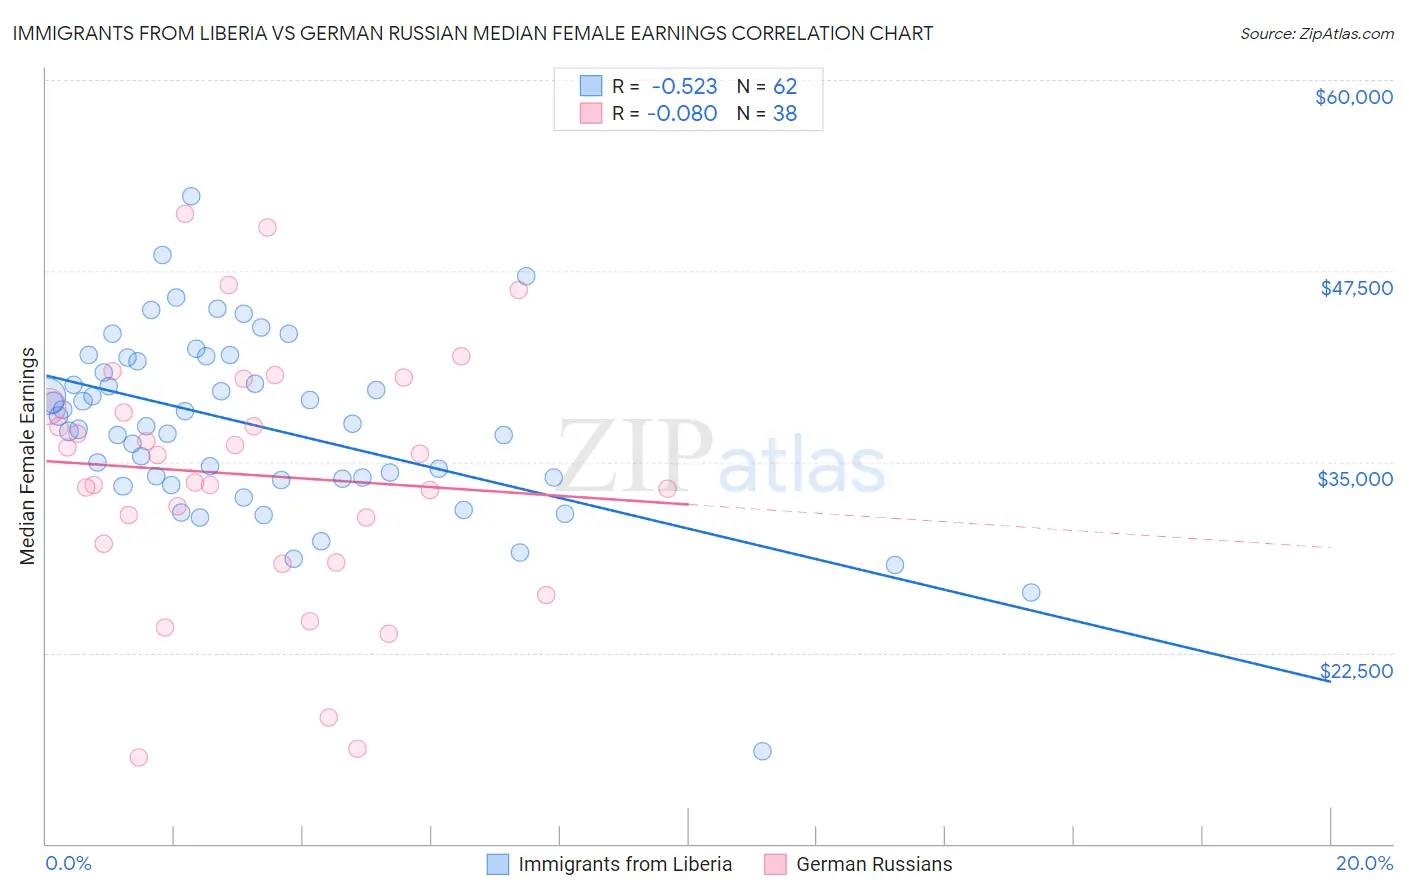
Immigrants from Liberia vs German Russian Median Female Earnings Correlation Chart
The statistical analysis conducted on geographies consisting of 135,268,038 people shows a substantial negative correlation between the proportion of Immigrants from Liberia and median female earnings in the United States with a correlation coefficient (R) of -0.523 and weighted average of $37,970. Similarly, the statistical analysis conducted on geographies consisting of 96,453,013 people shows a slight negative correlation between the proportion of German Russians and median female earnings in the United States with a correlation coefficient (R) of -0.080 and weighted average of $37,105, a difference of 2.3%.
Median Female Earnings Correlation Summary
| Measurement | Immigrants from Liberia | German Russian |
| Minimum | $16,076 | $15,652 |
| Maximum | $52,381 | $51,256 |
| Range | $36,305 | $35,604 |
| Mean | $37,357 | $34,138 |
| Median | $37,425 | $34,536 |
| Interquartile 25% (IQ1) | $33,898 | $29,635 |
| Interquartile 75% (IQ3) | $41,557 | $38,614 |
| Interquartile Range (IQR) | $7,659 | $8,979 |
| Standard Deviation (Sample) | $5,953 | $8,300 |
| Standard Deviation (Population) | $5,904 | $8,190 |
Demographics Similar to Immigrants from Liberia and German Russians by Median Female Earnings
In terms of median female earnings, the demographic groups most similar to Immigrants from Liberia are Immigrants from Middle Africa ($37,965, a difference of 0.010%), Delaware ($37,964, a difference of 0.010%), German ($37,986, a difference of 0.040%), Immigrants from Somalia ($37,914, a difference of 0.15%), and Alaskan Athabascan ($37,905, a difference of 0.17%). Similarly, the demographic groups most similar to German Russians are Venezuelan ($37,282, a difference of 0.48%), Malaysian ($37,298, a difference of 0.52%), Dutch ($37,339, a difference of 0.63%), Scotch-Irish ($37,383, a difference of 0.75%), and Belizean ($37,429, a difference of 0.87%).
| Demographics | Rating | Rank | Median Female Earnings |
| Germans | 2.8 /100 | #243 | Tragic $37,986 |
| Immigrants | Liberia | 2.7 /100 | #244 | Tragic $37,970 |
| Immigrants | Middle Africa | 2.7 /100 | #245 | Tragic $37,965 |
| Delaware | 2.6 /100 | #246 | Tragic $37,964 |
| Immigrants | Somalia | 2.4 /100 | #247 | Tragic $37,914 |
| Alaskan Athabascans | 2.3 /100 | #248 | Tragic $37,905 |
| Swiss | 2.3 /100 | #249 | Tragic $37,904 |
| Immigrants | Iraq | 2.2 /100 | #250 | Tragic $37,864 |
| Welsh | 2.1 /100 | #251 | Tragic $37,856 |
| Immigrants | Dominica | 2.0 /100 | #252 | Tragic $37,825 |
| Danes | 1.6 /100 | #253 | Tragic $37,730 |
| Whites/Caucasians | 1.1 /100 | #254 | Tragic $37,531 |
| Colville | 1.1 /100 | #255 | Tragic $37,514 |
| Samoans | 1.0 /100 | #256 | Tragic $37,498 |
| Hawaiians | 1.0 /100 | #257 | Tragic $37,497 |
| Belizeans | 0.9 /100 | #258 | Tragic $37,429 |
| Scotch-Irish | 0.8 /100 | #259 | Tragic $37,383 |
| Dutch | 0.7 /100 | #260 | Tragic $37,339 |
| Malaysians | 0.7 /100 | #261 | Tragic $37,298 |
| Venezuelans | 0.7 /100 | #262 | Tragic $37,282 |
| German Russians | 0.5 /100 | #263 | Tragic $37,105 |