Immigrants from Liberia vs Colville Median Female Earnings
COMPARE
Immigrants from Liberia
Colville
Median Female Earnings
Median Female Earnings Comparison
Immigrants from Liberia
Colville
$37,970
MEDIAN FEMALE EARNINGS
2.7/ 100
METRIC RATING
244th/ 347
METRIC RANK
$37,514
MEDIAN FEMALE EARNINGS
1.1/ 100
METRIC RATING
255th/ 347
METRIC RANK
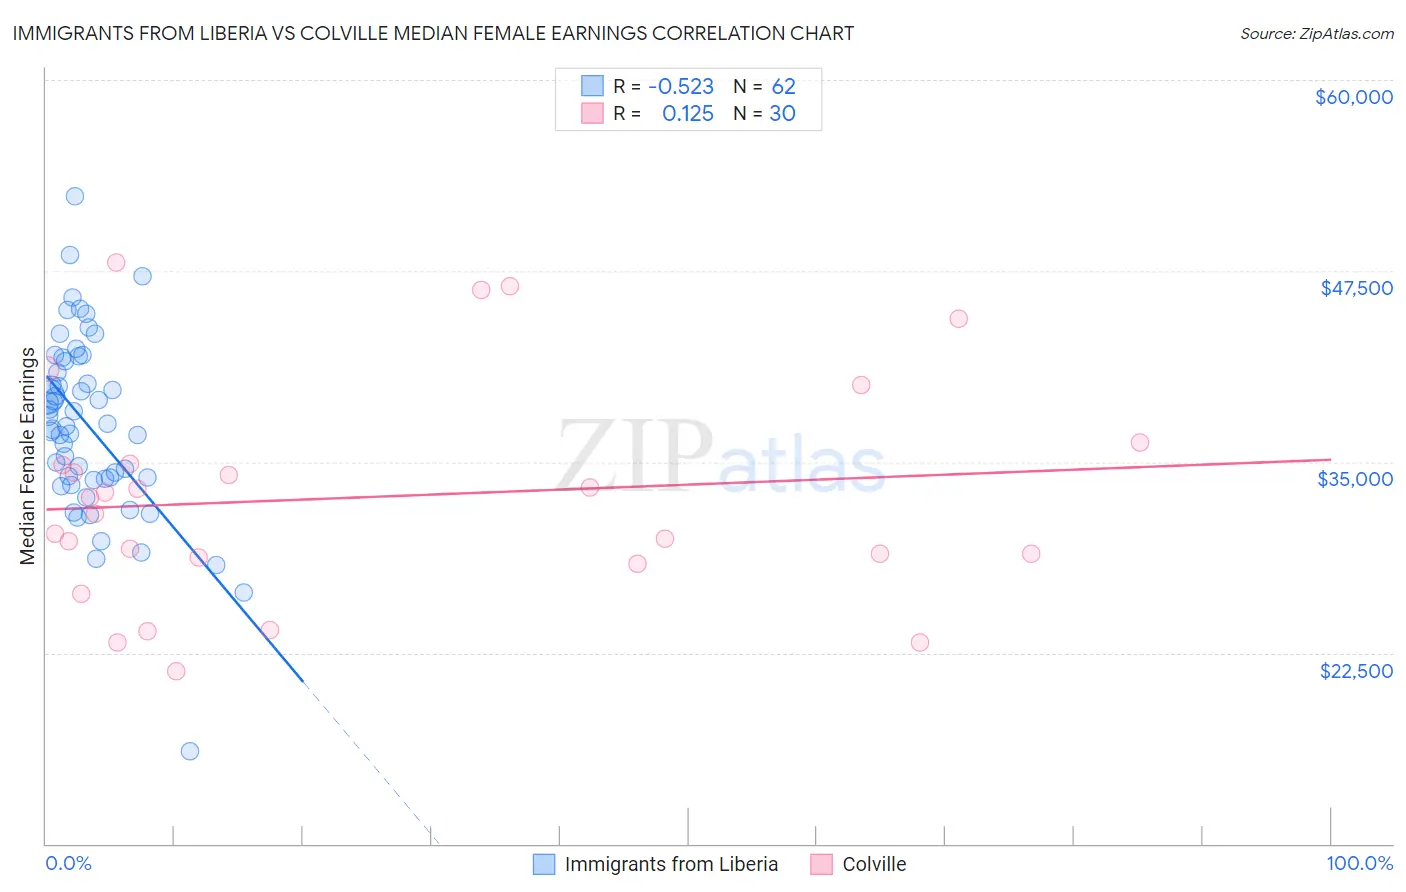
Immigrants from Liberia vs Colville Median Female Earnings Correlation Chart
The statistical analysis conducted on geographies consisting of 135,268,038 people shows a substantial negative correlation between the proportion of Immigrants from Liberia and median female earnings in the United States with a correlation coefficient (R) of -0.523 and weighted average of $37,970. Similarly, the statistical analysis conducted on geographies consisting of 34,680,169 people shows a poor positive correlation between the proportion of Colville and median female earnings in the United States with a correlation coefficient (R) of 0.125 and weighted average of $37,514, a difference of 1.2%.
Median Female Earnings Correlation Summary
| Measurement | Immigrants from Liberia | Colville |
| Minimum | $16,076 | $21,333 |
| Maximum | $52,381 | $48,065 |
| Range | $36,305 | $26,732 |
| Mean | $37,357 | $32,694 |
| Median | $37,425 | $32,120 |
| Interquartile 25% (IQ1) | $33,898 | $28,750 |
| Interquartile 75% (IQ3) | $41,557 | $34,898 |
| Interquartile Range (IQR) | $7,659 | $6,148 |
| Standard Deviation (Sample) | $5,953 | $7,179 |
| Standard Deviation (Population) | $5,904 | $7,058 |
Demographics Similar to Immigrants from Liberia and Colville by Median Female Earnings
In terms of median female earnings, the demographic groups most similar to Immigrants from Liberia are Immigrants from Middle Africa ($37,965, a difference of 0.010%), Delaware ($37,964, a difference of 0.010%), German ($37,986, a difference of 0.040%), Immigrants from Burma/Myanmar ($38,028, a difference of 0.15%), and Immigrants from Somalia ($37,914, a difference of 0.15%). Similarly, the demographic groups most similar to Colville are White/Caucasian ($37,531, a difference of 0.040%), Samoan ($37,498, a difference of 0.040%), Hawaiian ($37,497, a difference of 0.040%), Belizean ($37,429, a difference of 0.23%), and Scotch-Irish ($37,383, a difference of 0.35%).
| Demographics | Rating | Rank | Median Female Earnings |
| English | 4.2 /100 | #239 | Tragic $38,196 |
| Finns | 4.0 /100 | #240 | Tragic $38,173 |
| Spanish | 3.5 /100 | #241 | Tragic $38,098 |
| Immigrants | Burma/Myanmar | 3.0 /100 | #242 | Tragic $38,028 |
| Germans | 2.8 /100 | #243 | Tragic $37,986 |
| Immigrants | Liberia | 2.7 /100 | #244 | Tragic $37,970 |
| Immigrants | Middle Africa | 2.7 /100 | #245 | Tragic $37,965 |
| Delaware | 2.6 /100 | #246 | Tragic $37,964 |
| Immigrants | Somalia | 2.4 /100 | #247 | Tragic $37,914 |
| Alaskan Athabascans | 2.3 /100 | #248 | Tragic $37,905 |
| Swiss | 2.3 /100 | #249 | Tragic $37,904 |
| Immigrants | Iraq | 2.2 /100 | #250 | Tragic $37,864 |
| Welsh | 2.1 /100 | #251 | Tragic $37,856 |
| Immigrants | Dominica | 2.0 /100 | #252 | Tragic $37,825 |
| Danes | 1.6 /100 | #253 | Tragic $37,730 |
| Whites/Caucasians | 1.1 /100 | #254 | Tragic $37,531 |
| Colville | 1.1 /100 | #255 | Tragic $37,514 |
| Samoans | 1.0 /100 | #256 | Tragic $37,498 |
| Hawaiians | 1.0 /100 | #257 | Tragic $37,497 |
| Belizeans | 0.9 /100 | #258 | Tragic $37,429 |
| Scotch-Irish | 0.8 /100 | #259 | Tragic $37,383 |