Peruvian vs Marshallese Median Female Earnings
COMPARE
Peruvian
Marshallese
Median Female Earnings
Median Female Earnings Comparison
Peruvians
Marshallese
$40,234
MEDIAN FEMALE EARNINGS
75.3/ 100
METRIC RATING
156th/ 347
METRIC RANK
$36,459
MEDIAN FEMALE EARNINGS
0.1/ 100
METRIC RATING
277th/ 347
METRIC RANK
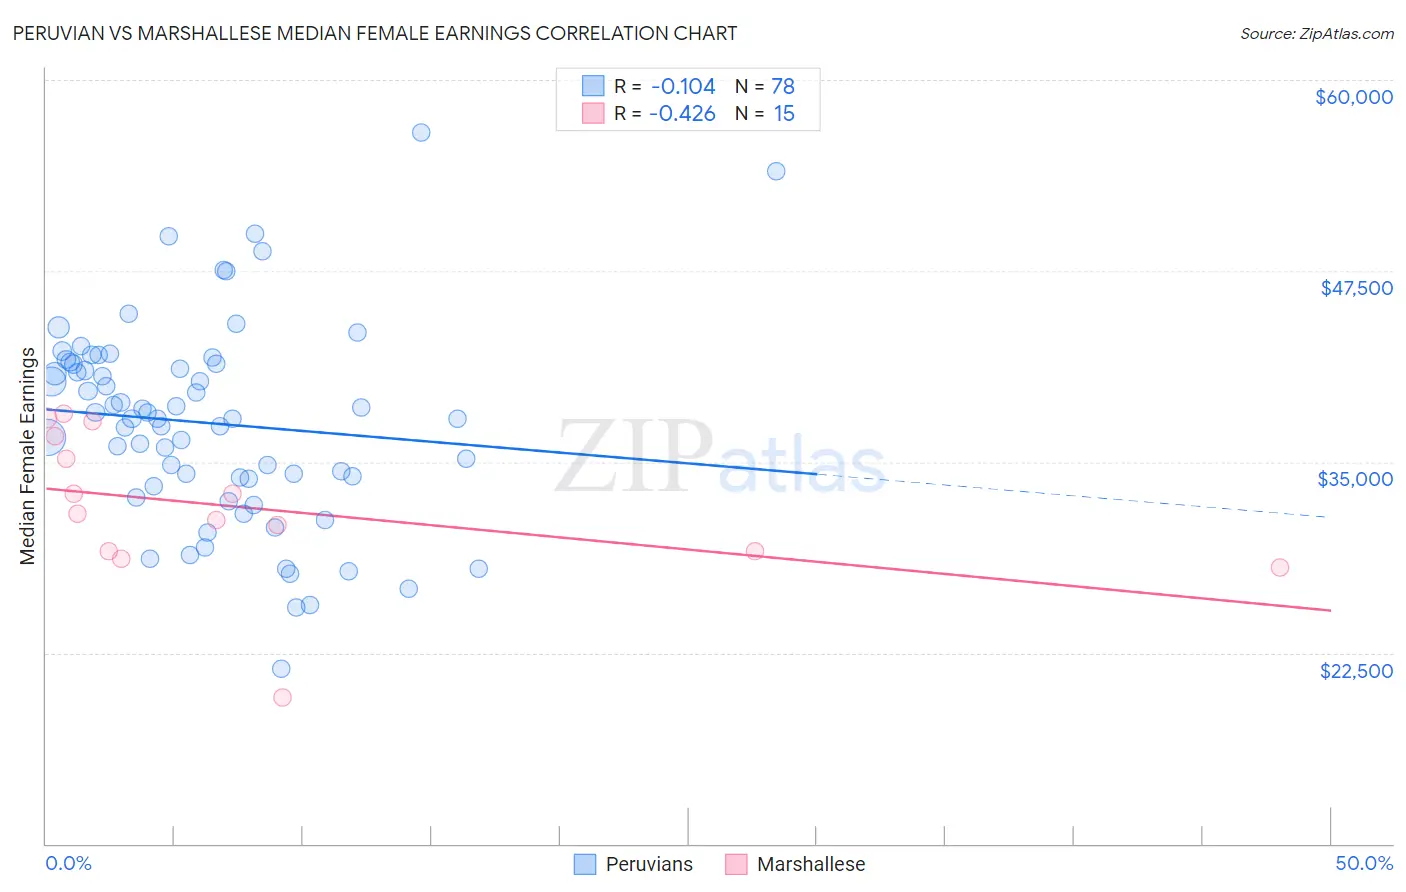
Peruvian vs Marshallese Median Female Earnings Correlation Chart
The statistical analysis conducted on geographies consisting of 363,169,099 people shows a poor negative correlation between the proportion of Peruvians and median female earnings in the United States with a correlation coefficient (R) of -0.104 and weighted average of $40,234. Similarly, the statistical analysis conducted on geographies consisting of 14,760,991 people shows a moderate negative correlation between the proportion of Marshallese and median female earnings in the United States with a correlation coefficient (R) of -0.426 and weighted average of $36,459, a difference of 10.3%.
Median Female Earnings Correlation Summary
| Measurement | Peruvian | Marshallese |
| Minimum | $21,456 | $19,583 |
| Maximum | $56,528 | $38,170 |
| Range | $35,072 | $18,587 |
| Mean | $37,547 | $31,981 |
| Median | $37,836 | $31,627 |
| Interquartile 25% (IQ1) | $33,920 | $29,109 |
| Interquartile 75% (IQ3) | $41,414 | $36,675 |
| Interquartile Range (IQR) | $7,494 | $7,566 |
| Standard Deviation (Sample) | $6,584 | $4,908 |
| Standard Deviation (Population) | $6,542 | $4,742 |
Similar Demographics by Median Female Earnings
Demographics Similar to Peruvians by Median Female Earnings
In terms of median female earnings, the demographic groups most similar to Peruvians are Immigrants from Africa ($40,257, a difference of 0.060%), Portuguese ($40,177, a difference of 0.14%), British West Indian ($40,299, a difference of 0.16%), Immigrants from Oceania ($40,297, a difference of 0.16%), and Immigrants from Senegal ($40,157, a difference of 0.19%).
| Demographics | Rating | Rank | Median Female Earnings |
| Immigrants | Cameroon | 79.7 /100 | #149 | Good $40,354 |
| Immigrants | Chile | 79.6 /100 | #150 | Good $40,353 |
| Immigrants | Armenia | 79.2 /100 | #151 | Good $40,340 |
| West Indians | 78.4 /100 | #152 | Good $40,317 |
| British West Indians | 77.7 /100 | #153 | Good $40,299 |
| Immigrants | Oceania | 77.6 /100 | #154 | Good $40,297 |
| Immigrants | Africa | 76.2 /100 | #155 | Good $40,257 |
| Peruvians | 75.3 /100 | #156 | Good $40,234 |
| Portuguese | 73.0 /100 | #157 | Good $40,177 |
| Immigrants | Senegal | 72.2 /100 | #158 | Good $40,157 |
| Immigrants | Vietnam | 72.0 /100 | #159 | Good $40,153 |
| Inupiat | 68.9 /100 | #160 | Good $40,080 |
| Alsatians | 68.0 /100 | #161 | Good $40,060 |
| South American Indians | 66.1 /100 | #162 | Good $40,019 |
| Lebanese | 65.5 /100 | #163 | Good $40,006 |
Demographics Similar to Marshallese by Median Female Earnings
In terms of median female earnings, the demographic groups most similar to Marshallese are Central American ($36,492, a difference of 0.090%), U.S. Virgin Islander ($36,424, a difference of 0.10%), Immigrants from Caribbean ($36,414, a difference of 0.12%), Iroquois ($36,408, a difference of 0.14%), and African ($36,530, a difference of 0.19%).
| Demographics | Rating | Rank | Median Female Earnings |
| French American Indians | 0.3 /100 | #270 | Tragic $36,920 |
| Nicaraguans | 0.3 /100 | #271 | Tragic $36,904 |
| Immigrants | Dominican Republic | 0.3 /100 | #272 | Tragic $36,857 |
| Immigrants | Laos | 0.3 /100 | #273 | Tragic $36,841 |
| Immigrants | El Salvador | 0.2 /100 | #274 | Tragic $36,673 |
| Africans | 0.1 /100 | #275 | Tragic $36,530 |
| Central Americans | 0.1 /100 | #276 | Tragic $36,492 |
| Marshallese | 0.1 /100 | #277 | Tragic $36,459 |
| U.S. Virgin Islanders | 0.1 /100 | #278 | Tragic $36,424 |
| Immigrants | Caribbean | 0.1 /100 | #279 | Tragic $36,414 |
| Iroquois | 0.1 /100 | #280 | Tragic $36,408 |
| Spanish Americans | 0.1 /100 | #281 | Tragic $36,391 |
| Haitians | 0.1 /100 | #282 | Tragic $36,374 |
| Immigrants | Haiti | 0.1 /100 | #283 | Tragic $36,203 |
| Indonesians | 0.1 /100 | #284 | Tragic $36,140 |