Immigrants from Moldova vs Marshallese Median Female Earnings
COMPARE
Immigrants from Moldova
Marshallese
Median Female Earnings
Median Female Earnings Comparison
Immigrants from Moldova
Marshallese
$42,304
MEDIAN FEMALE EARNINGS
99.6/ 100
METRIC RATING
80th/ 347
METRIC RANK
$36,459
MEDIAN FEMALE EARNINGS
0.1/ 100
METRIC RATING
277th/ 347
METRIC RANK
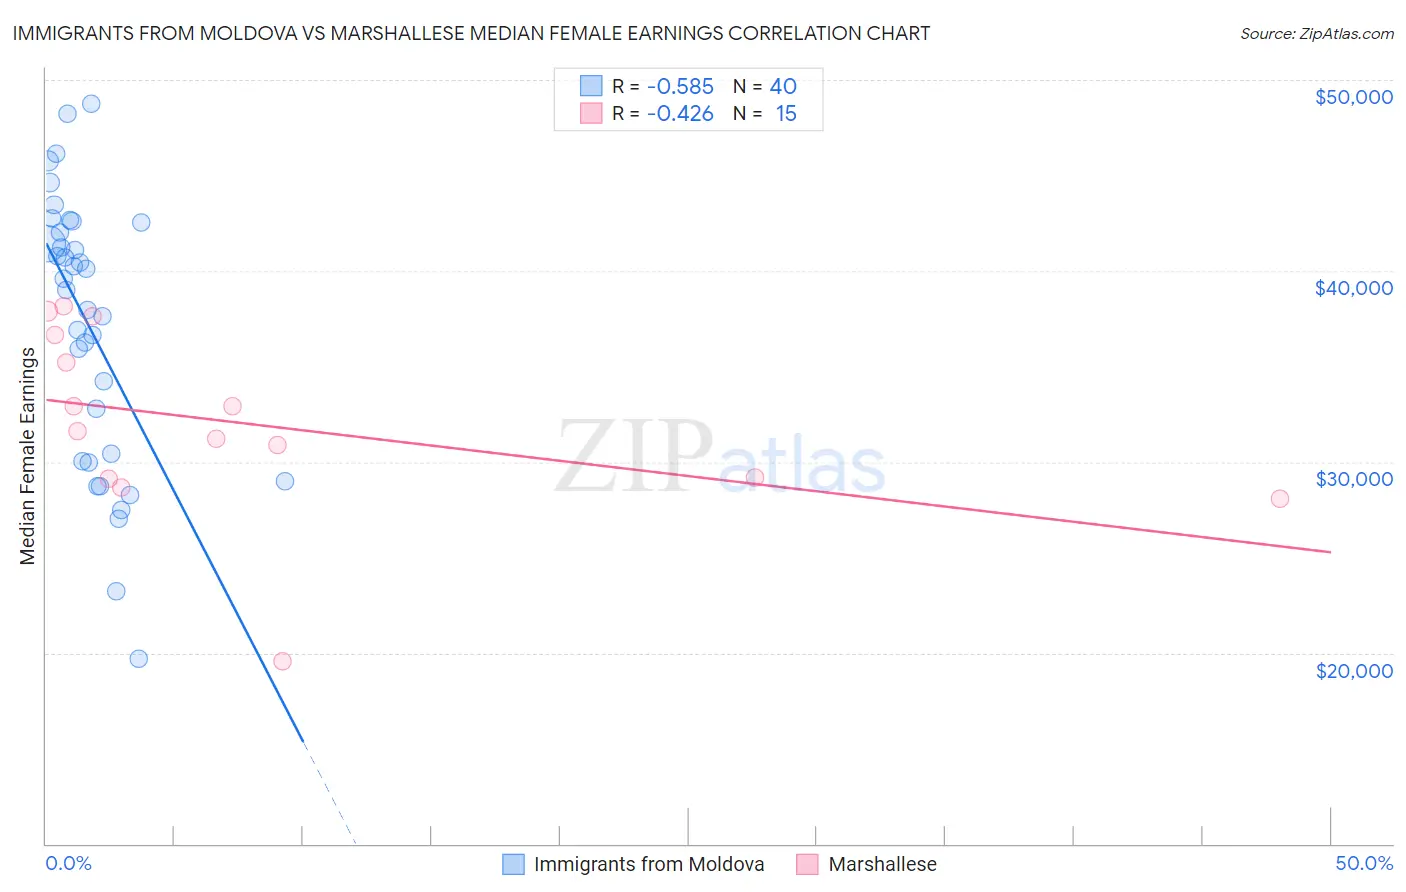
Immigrants from Moldova vs Marshallese Median Female Earnings Correlation Chart
The statistical analysis conducted on geographies consisting of 124,390,401 people shows a substantial negative correlation between the proportion of Immigrants from Moldova and median female earnings in the United States with a correlation coefficient (R) of -0.585 and weighted average of $42,304. Similarly, the statistical analysis conducted on geographies consisting of 14,760,991 people shows a moderate negative correlation between the proportion of Marshallese and median female earnings in the United States with a correlation coefficient (R) of -0.426 and weighted average of $36,459, a difference of 16.0%.
Median Female Earnings Correlation Summary
| Measurement | Immigrants from Moldova | Marshallese |
| Minimum | $19,712 | $19,583 |
| Maximum | $48,785 | $38,170 |
| Range | $29,073 | $18,587 |
| Mean | $37,125 | $31,981 |
| Median | $39,287 | $31,627 |
| Interquartile 25% (IQ1) | $30,213 | $29,109 |
| Interquartile 75% (IQ3) | $42,291 | $36,675 |
| Interquartile Range (IQR) | $12,078 | $7,566 |
| Standard Deviation (Sample) | $7,033 | $4,908 |
| Standard Deviation (Population) | $6,945 | $4,742 |
Similar Demographics by Median Female Earnings
Demographics Similar to Immigrants from Moldova by Median Female Earnings
In terms of median female earnings, the demographic groups most similar to Immigrants from Moldova are Immigrants from Southern Europe ($42,275, a difference of 0.070%), Greek ($42,336, a difference of 0.080%), Immigrants from Morocco ($42,229, a difference of 0.18%), Immigrants from Kazakhstan ($42,386, a difference of 0.19%), and Immigrants from Albania ($42,388, a difference of 0.20%).
| Demographics | Rating | Rank | Median Female Earnings |
| Mongolians | 99.7 /100 | #73 | Exceptional $42,542 |
| Immigrants | South Africa | 99.7 /100 | #74 | Exceptional $42,508 |
| New Zealanders | 99.7 /100 | #75 | Exceptional $42,446 |
| Immigrants | Italy | 99.7 /100 | #76 | Exceptional $42,446 |
| Immigrants | Albania | 99.6 /100 | #77 | Exceptional $42,388 |
| Immigrants | Kazakhstan | 99.6 /100 | #78 | Exceptional $42,386 |
| Greeks | 99.6 /100 | #79 | Exceptional $42,336 |
| Immigrants | Moldova | 99.6 /100 | #80 | Exceptional $42,304 |
| Immigrants | Southern Europe | 99.5 /100 | #81 | Exceptional $42,275 |
| Immigrants | Morocco | 99.5 /100 | #82 | Exceptional $42,229 |
| Immigrants | Sierra Leone | 99.5 /100 | #83 | Exceptional $42,214 |
| Armenians | 99.5 /100 | #84 | Exceptional $42,212 |
| Laotians | 99.4 /100 | #85 | Exceptional $42,133 |
| Immigrants | St. Vincent and the Grenadines | 99.3 /100 | #86 | Exceptional $42,108 |
| Lithuanians | 99.3 /100 | #87 | Exceptional $42,108 |
Demographics Similar to Marshallese by Median Female Earnings
In terms of median female earnings, the demographic groups most similar to Marshallese are Central American ($36,492, a difference of 0.090%), U.S. Virgin Islander ($36,424, a difference of 0.10%), Immigrants from Caribbean ($36,414, a difference of 0.12%), Iroquois ($36,408, a difference of 0.14%), and African ($36,530, a difference of 0.19%).
| Demographics | Rating | Rank | Median Female Earnings |
| French American Indians | 0.3 /100 | #270 | Tragic $36,920 |
| Nicaraguans | 0.3 /100 | #271 | Tragic $36,904 |
| Immigrants | Dominican Republic | 0.3 /100 | #272 | Tragic $36,857 |
| Immigrants | Laos | 0.3 /100 | #273 | Tragic $36,841 |
| Immigrants | El Salvador | 0.2 /100 | #274 | Tragic $36,673 |
| Africans | 0.1 /100 | #275 | Tragic $36,530 |
| Central Americans | 0.1 /100 | #276 | Tragic $36,492 |
| Marshallese | 0.1 /100 | #277 | Tragic $36,459 |
| U.S. Virgin Islanders | 0.1 /100 | #278 | Tragic $36,424 |
| Immigrants | Caribbean | 0.1 /100 | #279 | Tragic $36,414 |
| Iroquois | 0.1 /100 | #280 | Tragic $36,408 |
| Spanish Americans | 0.1 /100 | #281 | Tragic $36,391 |
| Haitians | 0.1 /100 | #282 | Tragic $36,374 |
| Immigrants | Haiti | 0.1 /100 | #283 | Tragic $36,203 |
| Indonesians | 0.1 /100 | #284 | Tragic $36,140 |