Immigrants from Liberia vs Immigrants from Iran Per Capita Income
COMPARE
Immigrants from Liberia
Immigrants from Iran
Per Capita Income
Per Capita Income Comparison
Immigrants from Liberia
Immigrants from Iran
$38,165
PER CAPITA INCOME
0.2/ 100
METRIC RATING
275th/ 347
METRIC RANK
$57,759
PER CAPITA INCOME
100.0/ 100
METRIC RATING
5th/ 347
METRIC RANK
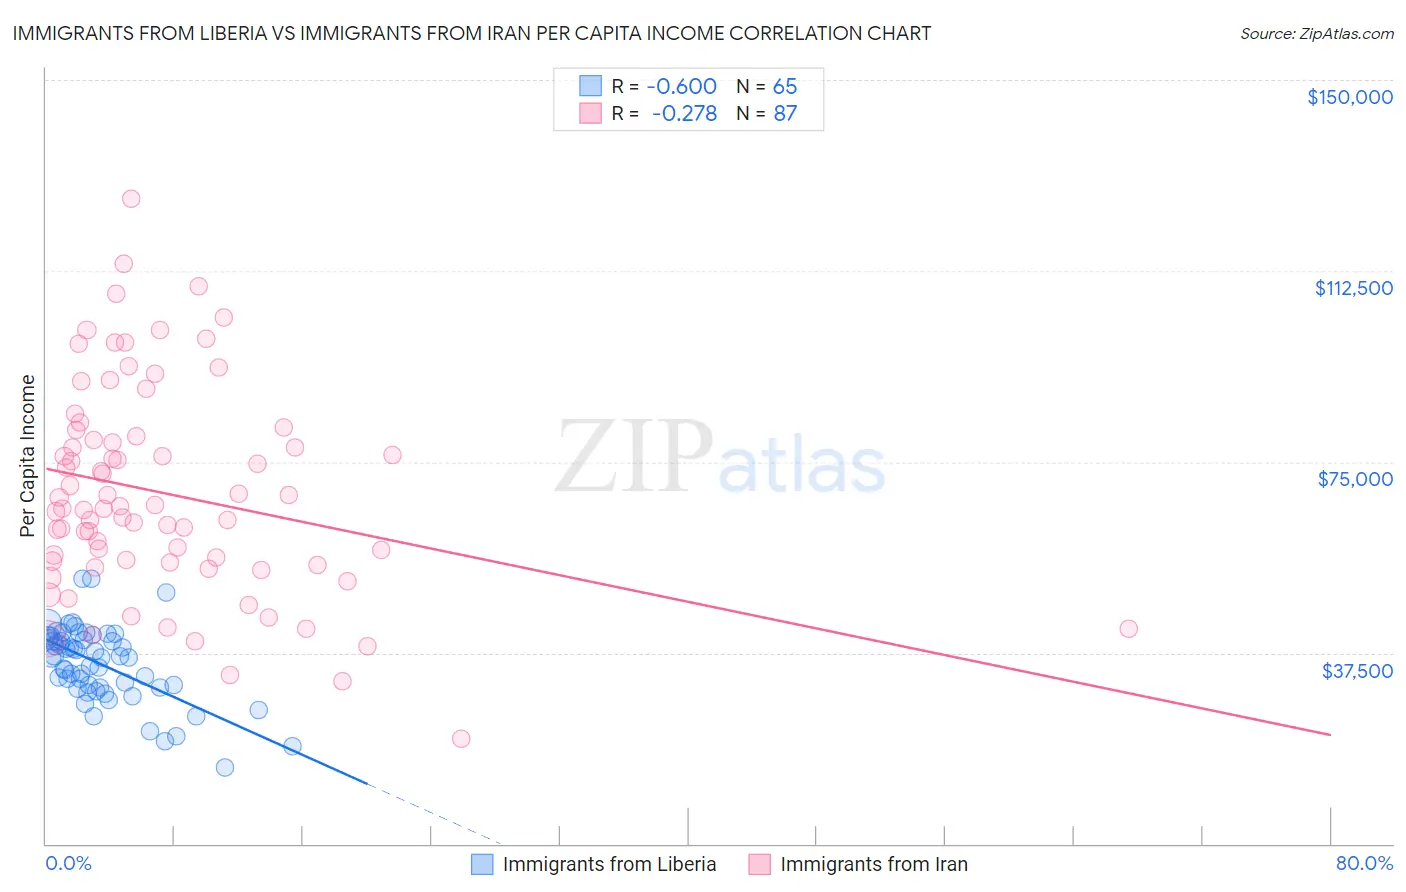
Immigrants from Liberia vs Immigrants from Iran Per Capita Income Correlation Chart
The statistical analysis conducted on geographies consisting of 135,297,410 people shows a substantial negative correlation between the proportion of Immigrants from Liberia and per capita income in the United States with a correlation coefficient (R) of -0.600 and weighted average of $38,165. Similarly, the statistical analysis conducted on geographies consisting of 279,905,207 people shows a weak negative correlation between the proportion of Immigrants from Iran and per capita income in the United States with a correlation coefficient (R) of -0.278 and weighted average of $57,759, a difference of 51.3%.
Per Capita Income Correlation Summary
| Measurement | Immigrants from Liberia | Immigrants from Iran |
| Minimum | $15,041 | $20,655 |
| Maximum | $52,065 | $126,563 |
| Range | $37,024 | $105,908 |
| Mean | $35,319 | $68,785 |
| Median | $36,534 | $65,816 |
| Interquartile 25% (IQ1) | $30,654 | $55,345 |
| Interquartile 75% (IQ3) | $40,514 | $79,969 |
| Interquartile Range (IQR) | $9,860 | $24,624 |
| Standard Deviation (Sample) | $7,386 | $20,524 |
| Standard Deviation (Population) | $7,329 | $20,406 |
Similar Demographics by Per Capita Income
Demographics Similar to Immigrants from Liberia by Per Capita Income
In terms of per capita income, the demographic groups most similar to Immigrants from Liberia are Hmong ($38,120, a difference of 0.12%), Comanche ($38,088, a difference of 0.20%), Immigrants from Nicaragua ($38,065, a difference of 0.26%), Colville ($38,047, a difference of 0.31%), and Potawatomi ($38,046, a difference of 0.31%).
| Demographics | Rating | Rank | Per Capita Income |
| Liberians | 0.4 /100 | #268 | Tragic $38,780 |
| Immigrants | Jamaica | 0.4 /100 | #269 | Tragic $38,766 |
| Immigrants | Belize | 0.3 /100 | #270 | Tragic $38,614 |
| Central Americans | 0.3 /100 | #271 | Tragic $38,560 |
| Immigrants | Cabo Verde | 0.3 /100 | #272 | Tragic $38,540 |
| Nepalese | 0.3 /100 | #273 | Tragic $38,442 |
| Immigrants | El Salvador | 0.3 /100 | #274 | Tragic $38,394 |
| Immigrants | Liberia | 0.2 /100 | #275 | Tragic $38,165 |
| Hmong | 0.2 /100 | #276 | Tragic $38,120 |
| Comanche | 0.2 /100 | #277 | Tragic $38,088 |
| Immigrants | Nicaragua | 0.2 /100 | #278 | Tragic $38,065 |
| Colville | 0.2 /100 | #279 | Tragic $38,047 |
| Potawatomi | 0.2 /100 | #280 | Tragic $38,046 |
| Immigrants | Dominica | 0.2 /100 | #281 | Tragic $37,952 |
| Immigrants | Laos | 0.1 /100 | #282 | Tragic $37,857 |
Demographics Similar to Immigrants from Iran by Per Capita Income
In terms of per capita income, the demographic groups most similar to Immigrants from Iran are Immigrants from Taiwan ($57,742, a difference of 0.030%), Immigrants from Australia ($57,953, a difference of 0.34%), Immigrants from Israel ($57,384, a difference of 0.65%), Immigrants from Singapore ($58,353, a difference of 1.0%), and Iranian ($58,786, a difference of 1.8%).
| Demographics | Rating | Rank | Per Capita Income |
| Filipinos | 100.0 /100 | #1 | Exceptional $59,066 |
| Iranians | 100.0 /100 | #2 | Exceptional $58,786 |
| Immigrants | Singapore | 100.0 /100 | #3 | Exceptional $58,353 |
| Immigrants | Australia | 100.0 /100 | #4 | Exceptional $57,953 |
| Immigrants | Iran | 100.0 /100 | #5 | Exceptional $57,759 |
| Immigrants | Taiwan | 100.0 /100 | #6 | Exceptional $57,742 |
| Immigrants | Israel | 100.0 /100 | #7 | Exceptional $57,384 |
| Immigrants | Hong Kong | 100.0 /100 | #8 | Exceptional $56,709 |
| Immigrants | Ireland | 100.0 /100 | #9 | Exceptional $56,584 |
| Okinawans | 100.0 /100 | #10 | Exceptional $55,817 |
| Eastern Europeans | 100.0 /100 | #11 | Exceptional $55,780 |
| Immigrants | Sweden | 100.0 /100 | #12 | Exceptional $55,582 |
| Immigrants | India | 100.0 /100 | #13 | Exceptional $55,268 |
| Immigrants | Belgium | 100.0 /100 | #14 | Exceptional $55,082 |
| Cypriots | 100.0 /100 | #15 | Exceptional $54,899 |