Immigrants from Liberia vs Ute Per Capita Income
COMPARE
Immigrants from Liberia
Ute
Per Capita Income
Per Capita Income Comparison
Immigrants from Liberia
Ute
$38,165
PER CAPITA INCOME
0.2/ 100
METRIC RATING
275th/ 347
METRIC RANK
$36,651
PER CAPITA INCOME
0.0/ 100
METRIC RATING
310th/ 347
METRIC RANK
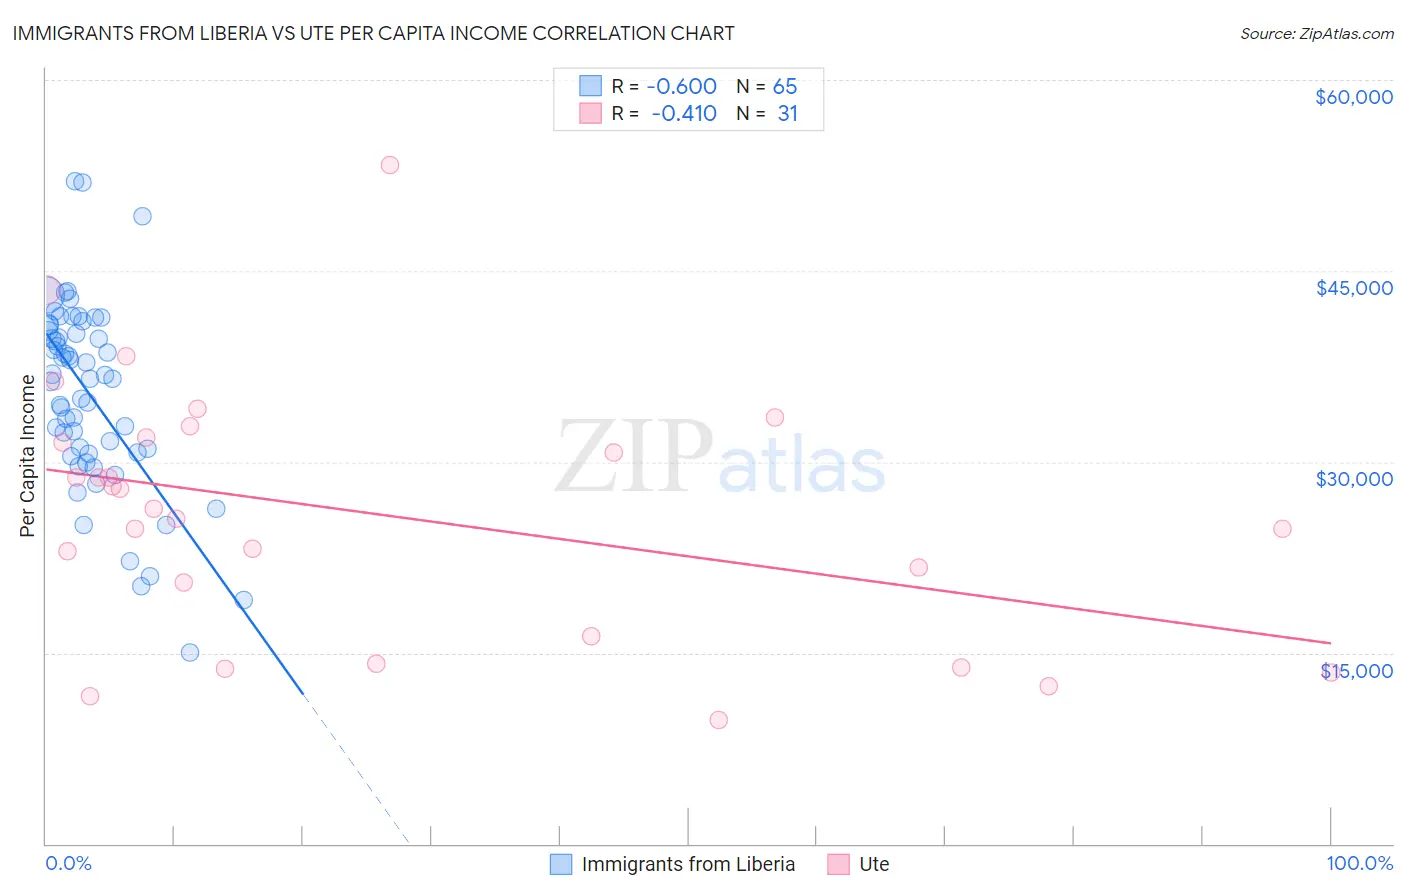
Immigrants from Liberia vs Ute Per Capita Income Correlation Chart
The statistical analysis conducted on geographies consisting of 135,297,410 people shows a substantial negative correlation between the proportion of Immigrants from Liberia and per capita income in the United States with a correlation coefficient (R) of -0.600 and weighted average of $38,165. Similarly, the statistical analysis conducted on geographies consisting of 55,660,141 people shows a moderate negative correlation between the proportion of Ute and per capita income in the United States with a correlation coefficient (R) of -0.410 and weighted average of $36,651, a difference of 4.1%.
Per Capita Income Correlation Summary
| Measurement | Immigrants from Liberia | Ute |
| Minimum | $15,041 | $9,749 |
| Maximum | $52,065 | $53,279 |
| Range | $37,024 | $43,530 |
| Mean | $35,319 | $25,907 |
| Median | $36,534 | $26,299 |
| Interquartile 25% (IQ1) | $30,654 | $16,307 |
| Interquartile 75% (IQ3) | $40,514 | $31,910 |
| Interquartile Range (IQR) | $9,860 | $15,603 |
| Standard Deviation (Sample) | $7,386 | $10,024 |
| Standard Deviation (Population) | $7,329 | $9,861 |
Similar Demographics by Per Capita Income
Demographics Similar to Immigrants from Liberia by Per Capita Income
In terms of per capita income, the demographic groups most similar to Immigrants from Liberia are Hmong ($38,120, a difference of 0.12%), Comanche ($38,088, a difference of 0.20%), Immigrants from Nicaragua ($38,065, a difference of 0.26%), Colville ($38,047, a difference of 0.31%), and Potawatomi ($38,046, a difference of 0.31%).
| Demographics | Rating | Rank | Per Capita Income |
| Liberians | 0.4 /100 | #268 | Tragic $38,780 |
| Immigrants | Jamaica | 0.4 /100 | #269 | Tragic $38,766 |
| Immigrants | Belize | 0.3 /100 | #270 | Tragic $38,614 |
| Central Americans | 0.3 /100 | #271 | Tragic $38,560 |
| Immigrants | Cabo Verde | 0.3 /100 | #272 | Tragic $38,540 |
| Nepalese | 0.3 /100 | #273 | Tragic $38,442 |
| Immigrants | El Salvador | 0.3 /100 | #274 | Tragic $38,394 |
| Immigrants | Liberia | 0.2 /100 | #275 | Tragic $38,165 |
| Hmong | 0.2 /100 | #276 | Tragic $38,120 |
| Comanche | 0.2 /100 | #277 | Tragic $38,088 |
| Immigrants | Nicaragua | 0.2 /100 | #278 | Tragic $38,065 |
| Colville | 0.2 /100 | #279 | Tragic $38,047 |
| Potawatomi | 0.2 /100 | #280 | Tragic $38,046 |
| Immigrants | Dominica | 0.2 /100 | #281 | Tragic $37,952 |
| Immigrants | Laos | 0.1 /100 | #282 | Tragic $37,857 |
Demographics Similar to Ute by Per Capita Income
In terms of per capita income, the demographic groups most similar to Ute are Immigrants from Honduras ($36,665, a difference of 0.040%), Chippewa ($36,631, a difference of 0.060%), Fijian ($36,690, a difference of 0.10%), Immigrants from Latin America ($36,823, a difference of 0.47%), and Chickasaw ($36,475, a difference of 0.48%).
| Demographics | Rating | Rank | Per Capita Income |
| Paiute | 0.1 /100 | #303 | Tragic $37,066 |
| Hondurans | 0.1 /100 | #304 | Tragic $37,031 |
| Inupiat | 0.1 /100 | #305 | Tragic $36,999 |
| Immigrants | Haiti | 0.0 /100 | #306 | Tragic $36,849 |
| Immigrants | Latin America | 0.0 /100 | #307 | Tragic $36,823 |
| Fijians | 0.0 /100 | #308 | Tragic $36,690 |
| Immigrants | Honduras | 0.0 /100 | #309 | Tragic $36,665 |
| Ute | 0.0 /100 | #310 | Tragic $36,651 |
| Chippewa | 0.0 /100 | #311 | Tragic $36,631 |
| Chickasaw | 0.0 /100 | #312 | Tragic $36,475 |
| Bahamians | 0.0 /100 | #313 | Tragic $36,427 |
| Seminole | 0.0 /100 | #314 | Tragic $36,180 |
| Yaqui | 0.0 /100 | #315 | Tragic $36,112 |
| Choctaw | 0.0 /100 | #316 | Tragic $35,999 |
| Dutch West Indians | 0.0 /100 | #317 | Tragic $35,922 |