Immigrants from Liberia vs Hawaiian Child Poverty Among Boys Under 16
COMPARE
Immigrants from Liberia
Hawaiian
Child Poverty Among Boys Under 16
Child Poverty Among Boys Under 16 Comparison
Immigrants from Liberia
Hawaiians
19.3%
CHILD POVERTY AMONG BOYS UNDER 16
0.2/ 100
METRIC RATING
256th/ 347
METRIC RANK
16.5%
CHILD POVERTY AMONG BOYS UNDER 16
45.5/ 100
METRIC RATING
180th/ 347
METRIC RANK
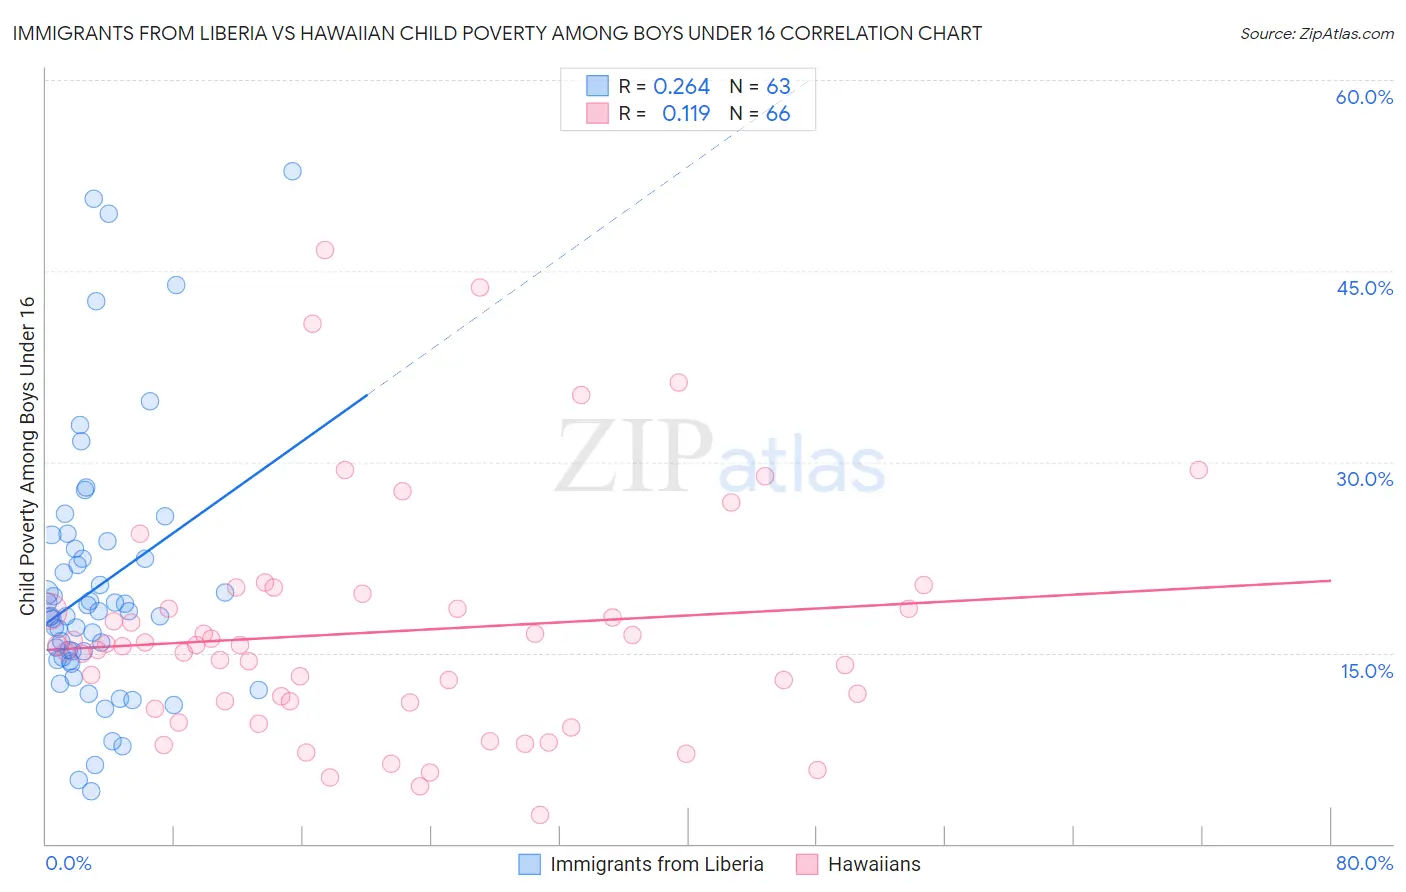
Immigrants from Liberia vs Hawaiian Child Poverty Among Boys Under 16 Correlation Chart
The statistical analysis conducted on geographies consisting of 134,835,664 people shows a weak positive correlation between the proportion of Immigrants from Liberia and poverty level among boys under the age of 16 in the United States with a correlation coefficient (R) of 0.264 and weighted average of 19.3%. Similarly, the statistical analysis conducted on geographies consisting of 324,264,970 people shows a poor positive correlation between the proportion of Hawaiians and poverty level among boys under the age of 16 in the United States with a correlation coefficient (R) of 0.119 and weighted average of 16.5%, a difference of 17.0%.
Child Poverty Among Boys Under 16 Correlation Summary
| Measurement | Immigrants from Liberia | Hawaiian |
| Minimum | 4.2% | 2.3% |
| Maximum | 52.8% | 46.7% |
| Range | 48.7% | 44.4% |
| Mean | 20.2% | 16.6% |
| Median | 17.9% | 15.6% |
| Interquartile 25% (IQ1) | 14.4% | 11.1% |
| Interquartile 75% (IQ3) | 23.2% | 18.5% |
| Interquartile Range (IQR) | 8.7% | 7.4% |
| Standard Deviation (Sample) | 10.3% | 9.2% |
| Standard Deviation (Population) | 10.2% | 9.1% |
Similar Demographics by Child Poverty Among Boys Under 16
Demographics Similar to Immigrants from Liberia by Child Poverty Among Boys Under 16
In terms of child poverty among boys under 16, the demographic groups most similar to Immigrants from Liberia are Trinidadian and Tobagonian (19.3%, a difference of 0.030%), Ecuadorian (19.3%, a difference of 0.030%), Mexican American Indian (19.4%, a difference of 0.21%), Potawatomi (19.4%, a difference of 0.22%), and Spanish American (19.4%, a difference of 0.24%).
| Demographics | Rating | Rank | Child Poverty Among Boys Under 16 |
| Alsatians | 0.3 /100 | #249 | Tragic 19.1% |
| Immigrants | Burma/Myanmar | 0.2 /100 | #250 | Tragic 19.2% |
| French American Indians | 0.2 /100 | #251 | Tragic 19.2% |
| Immigrants | Western Africa | 0.2 /100 | #252 | Tragic 19.3% |
| Liberians | 0.2 /100 | #253 | Tragic 19.3% |
| Trinidadians and Tobagonians | 0.2 /100 | #254 | Tragic 19.3% |
| Ecuadorians | 0.2 /100 | #255 | Tragic 19.3% |
| Immigrants | Liberia | 0.2 /100 | #256 | Tragic 19.3% |
| Mexican American Indians | 0.2 /100 | #257 | Tragic 19.4% |
| Potawatomi | 0.2 /100 | #258 | Tragic 19.4% |
| Spanish Americans | 0.2 /100 | #259 | Tragic 19.4% |
| Shoshone | 0.2 /100 | #260 | Tragic 19.4% |
| Immigrants | Ghana | 0.2 /100 | #261 | Tragic 19.4% |
| Immigrants | Guyana | 0.1 /100 | #262 | Tragic 19.5% |
| Ottawa | 0.1 /100 | #263 | Tragic 19.5% |
Demographics Similar to Hawaiians by Child Poverty Among Boys Under 16
In terms of child poverty among boys under 16, the demographic groups most similar to Hawaiians are South American Indian (16.5%, a difference of 0.14%), Hungarian (16.5%, a difference of 0.20%), Scotch-Irish (16.5%, a difference of 0.22%), Lebanese (16.6%, a difference of 0.25%), and Ethiopian (16.5%, a difference of 0.26%).
| Demographics | Rating | Rank | Child Poverty Among Boys Under 16 |
| Tsimshian | 50.5 /100 | #173 | Average 16.4% |
| Uruguayans | 50.0 /100 | #174 | Average 16.4% |
| Immigrants | Syria | 49.0 /100 | #175 | Average 16.5% |
| Whites/Caucasians | 48.2 /100 | #176 | Average 16.5% |
| Ethiopians | 47.8 /100 | #177 | Average 16.5% |
| Scotch-Irish | 47.5 /100 | #178 | Average 16.5% |
| Hungarians | 47.3 /100 | #179 | Average 16.5% |
| Hawaiians | 45.5 /100 | #180 | Average 16.5% |
| South American Indians | 44.3 /100 | #181 | Average 16.5% |
| Lebanese | 43.3 /100 | #182 | Average 16.6% |
| Kenyans | 41.0 /100 | #183 | Average 16.6% |
| Celtics | 40.6 /100 | #184 | Average 16.6% |
| Immigrants | Western Asia | 40.4 /100 | #185 | Average 16.6% |
| Hmong | 38.4 /100 | #186 | Fair 16.6% |
| Immigrants | Costa Rica | 37.8 /100 | #187 | Fair 16.7% |