Immigrants from Uganda vs German Russian Median Female Earnings
COMPARE
Immigrants from Uganda
German Russian
Median Female Earnings
Median Female Earnings Comparison
Immigrants from Uganda
German Russians
$40,739
MEDIAN FEMALE EARNINGS
89.7/ 100
METRIC RATING
132nd/ 347
METRIC RANK
$37,105
MEDIAN FEMALE EARNINGS
0.5/ 100
METRIC RATING
263rd/ 347
METRIC RANK
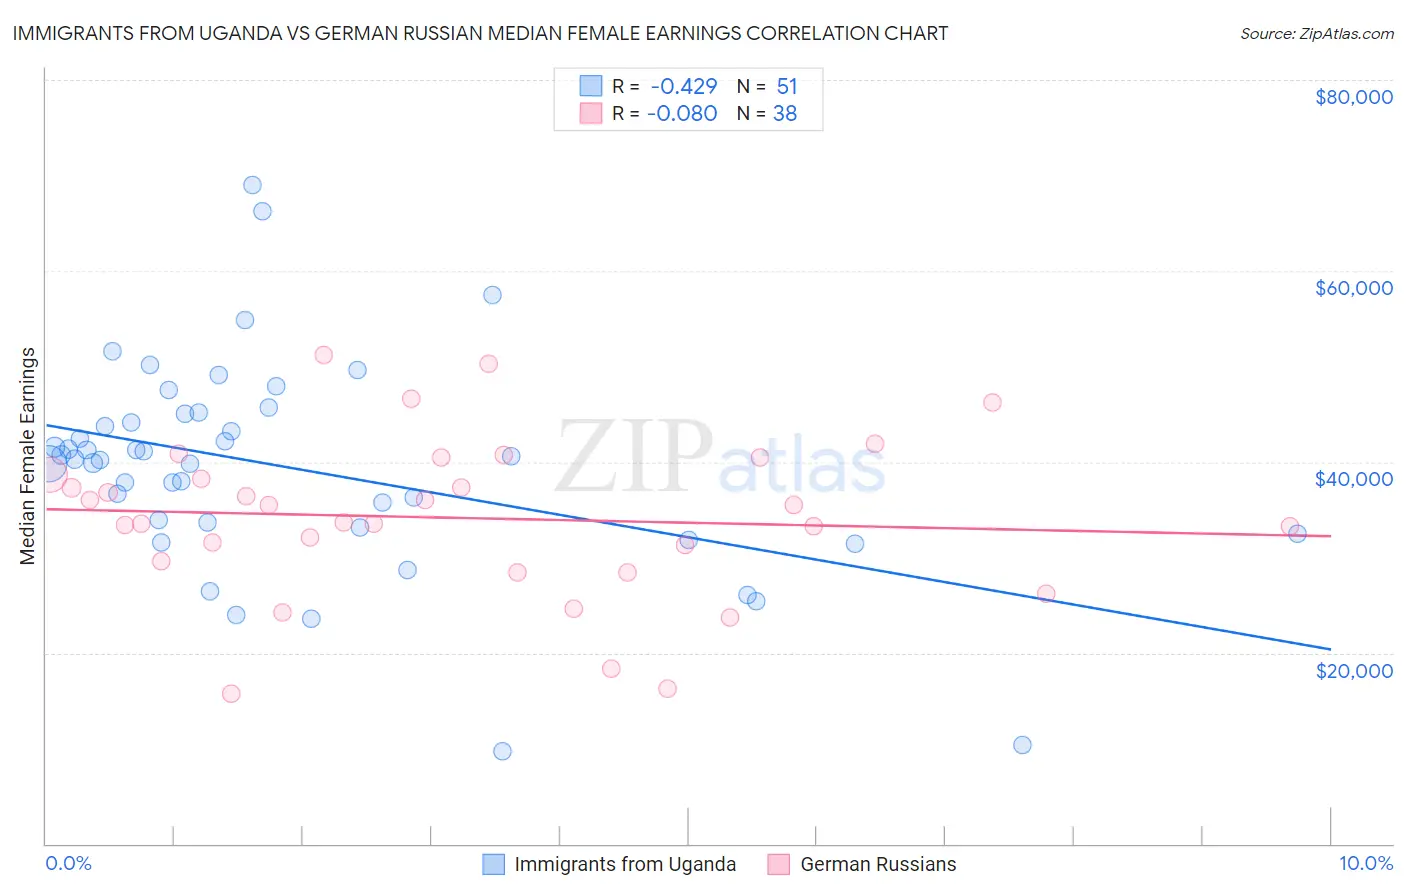
Immigrants from Uganda vs German Russian Median Female Earnings Correlation Chart
The statistical analysis conducted on geographies consisting of 125,969,564 people shows a moderate negative correlation between the proportion of Immigrants from Uganda and median female earnings in the United States with a correlation coefficient (R) of -0.429 and weighted average of $40,739. Similarly, the statistical analysis conducted on geographies consisting of 96,453,013 people shows a slight negative correlation between the proportion of German Russians and median female earnings in the United States with a correlation coefficient (R) of -0.080 and weighted average of $37,105, a difference of 9.8%.
Median Female Earnings Correlation Summary
| Measurement | Immigrants from Uganda | German Russian |
| Minimum | $9,732 | $15,652 |
| Maximum | $69,004 | $51,256 |
| Range | $59,272 | $35,604 |
| Mean | $39,368 | $34,138 |
| Median | $40,305 | $34,536 |
| Interquartile 25% (IQ1) | $33,173 | $29,635 |
| Interquartile 75% (IQ3) | $44,985 | $38,614 |
| Interquartile Range (IQR) | $11,812 | $8,979 |
| Standard Deviation (Sample) | $11,139 | $8,300 |
| Standard Deviation (Population) | $11,029 | $8,190 |
Similar Demographics by Median Female Earnings
Demographics Similar to Immigrants from Uganda by Median Female Earnings
In terms of median female earnings, the demographic groups most similar to Immigrants from Uganda are Syrian ($40,727, a difference of 0.030%), Chilean ($40,757, a difference of 0.040%), Arab ($40,718, a difference of 0.050%), Immigrants from Guyana ($40,773, a difference of 0.080%), and Immigrants from Nepal ($40,704, a difference of 0.090%).
| Demographics | Rating | Rank | Median Female Earnings |
| Austrians | 92.7 /100 | #125 | Exceptional $40,923 |
| Immigrants | Trinidad and Tobago | 92.3 /100 | #126 | Exceptional $40,895 |
| Ugandans | 92.2 /100 | #127 | Exceptional $40,889 |
| Carpatho Rusyns | 91.2 /100 | #128 | Exceptional $40,825 |
| Zimbabweans | 90.8 /100 | #129 | Exceptional $40,798 |
| Immigrants | Guyana | 90.3 /100 | #130 | Exceptional $40,773 |
| Chileans | 90.0 /100 | #131 | Exceptional $40,757 |
| Immigrants | Uganda | 89.7 /100 | #132 | Excellent $40,739 |
| Syrians | 89.5 /100 | #133 | Excellent $40,727 |
| Arabs | 89.3 /100 | #134 | Excellent $40,718 |
| Immigrants | Nepal | 89.0 /100 | #135 | Excellent $40,704 |
| Immigrants | Eastern Africa | 87.7 /100 | #136 | Excellent $40,644 |
| Pakistanis | 86.6 /100 | #137 | Excellent $40,596 |
| Taiwanese | 86.1 /100 | #138 | Excellent $40,576 |
| Immigrants | South Eastern Asia | 85.7 /100 | #139 | Excellent $40,558 |
Demographics Similar to German Russians by Median Female Earnings
In terms of median female earnings, the demographic groups most similar to German Russians are Salvadoran ($37,083, a difference of 0.060%), Immigrants from Belize ($37,056, a difference of 0.13%), Dominican ($37,046, a difference of 0.16%), Nonimmigrants ($37,024, a difference of 0.22%), and Cree ($37,018, a difference of 0.24%).
| Demographics | Rating | Rank | Median Female Earnings |
| Samoans | 1.0 /100 | #256 | Tragic $37,498 |
| Hawaiians | 1.0 /100 | #257 | Tragic $37,497 |
| Belizeans | 0.9 /100 | #258 | Tragic $37,429 |
| Scotch-Irish | 0.8 /100 | #259 | Tragic $37,383 |
| Dutch | 0.7 /100 | #260 | Tragic $37,339 |
| Malaysians | 0.7 /100 | #261 | Tragic $37,298 |
| Venezuelans | 0.7 /100 | #262 | Tragic $37,282 |
| German Russians | 0.5 /100 | #263 | Tragic $37,105 |
| Salvadorans | 0.4 /100 | #264 | Tragic $37,083 |
| Immigrants | Belize | 0.4 /100 | #265 | Tragic $37,056 |
| Dominicans | 0.4 /100 | #266 | Tragic $37,046 |
| Immigrants | Nonimmigrants | 0.4 /100 | #267 | Tragic $37,024 |
| Cree | 0.4 /100 | #268 | Tragic $37,018 |
| Immigrants | Venezuela | 0.4 /100 | #269 | Tragic $37,003 |
| French American Indians | 0.3 /100 | #270 | Tragic $36,920 |