Immigrants from Liberia vs German Russian Unemployment Among Women with Children Under 6 years
COMPARE
Immigrants from Liberia
German Russian
Unemployment Among Women with Children Under 6 years
Unemployment Among Women with Children Under 6 years Comparison
Immigrants from Liberia
German Russians
8.4%
UNEMPLOYMENT AMONG WOMEN WITH CHILDREN UNDER 6 YEARS
0.3/ 100
METRIC RATING
261st/ 347
METRIC RANK
8.2%
UNEMPLOYMENT AMONG WOMEN WITH CHILDREN UNDER 6 YEARS
1.2/ 100
METRIC RATING
247th/ 347
METRIC RANK
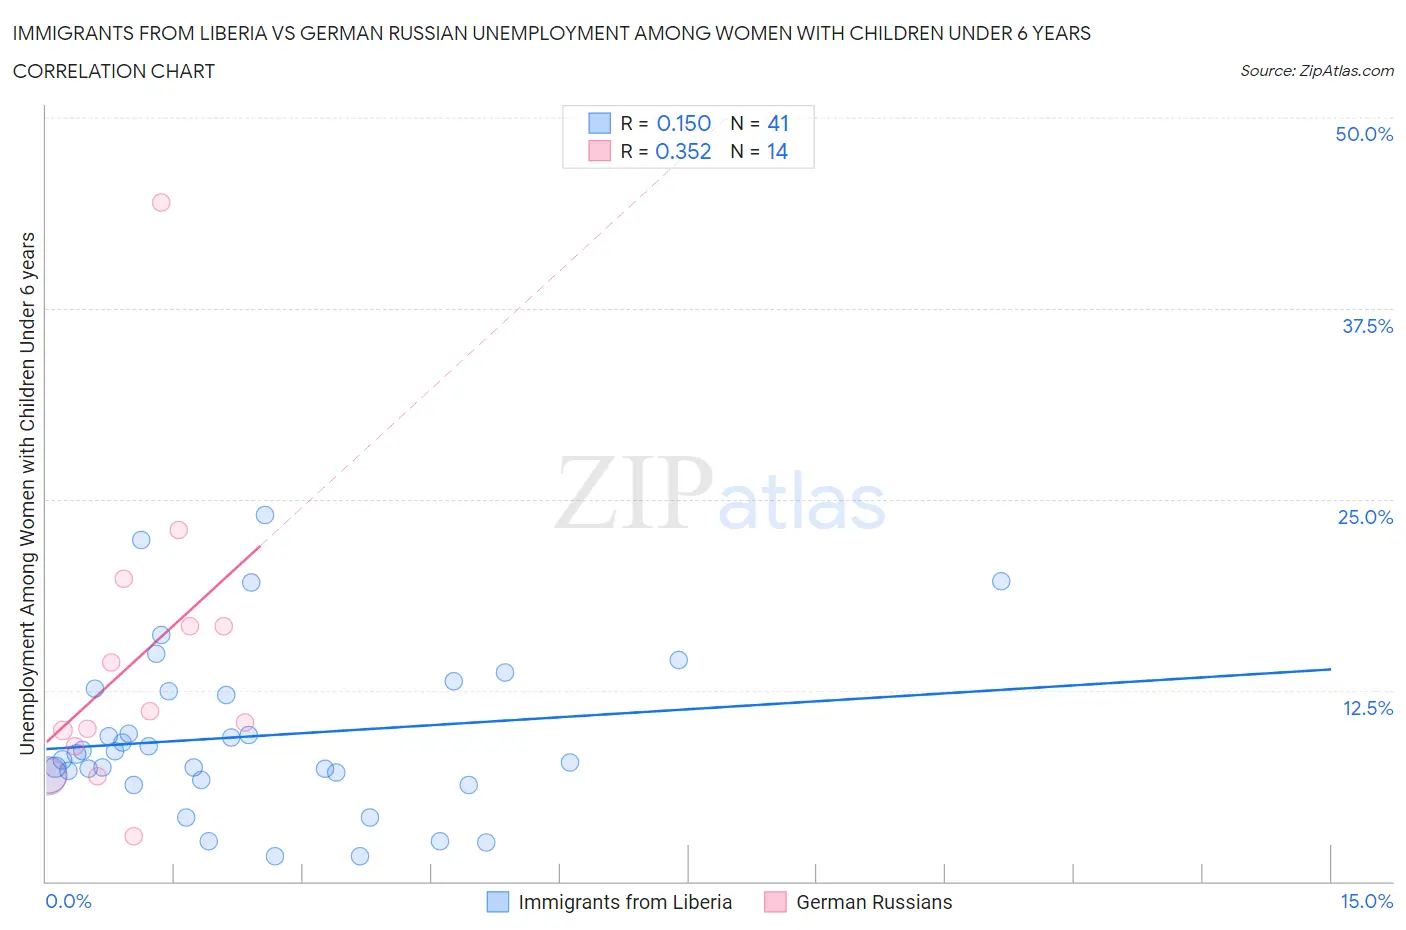
Immigrants from Liberia vs German Russian Unemployment Among Women with Children Under 6 years Correlation Chart
The statistical analysis conducted on geographies consisting of 122,027,858 people shows a poor positive correlation between the proportion of Immigrants from Liberia and unemployment rate among women with children under the age of 6 in the United States with a correlation coefficient (R) of 0.150 and weighted average of 8.4%. Similarly, the statistical analysis conducted on geographies consisting of 86,977,720 people shows a mild positive correlation between the proportion of German Russians and unemployment rate among women with children under the age of 6 in the United States with a correlation coefficient (R) of 0.352 and weighted average of 8.2%, a difference of 2.2%.
Unemployment Among Women with Children Under 6 years Correlation Summary
| Measurement | Immigrants from Liberia | German Russian |
| Minimum | 1.6% | 2.9% |
| Maximum | 24.0% | 44.5% |
| Range | 22.4% | 41.5% |
| Mean | 9.5% | 14.4% |
| Median | 8.3% | 10.8% |
| Interquartile 25% (IQ1) | 6.8% | 8.9% |
| Interquartile 75% (IQ3) | 12.5% | 16.7% |
| Interquartile Range (IQR) | 5.7% | 7.8% |
| Standard Deviation (Sample) | 5.3% | 10.2% |
| Standard Deviation (Population) | 5.3% | 9.9% |
Demographics Similar to Immigrants from Liberia and German Russians by Unemployment Among Women with Children Under 6 years
In terms of unemployment among women with children under 6 years, the demographic groups most similar to Immigrants from Liberia are West Indian (8.4%, a difference of 0.010%), Scotch-Irish (8.4%, a difference of 0.040%), Honduran (8.4%, a difference of 0.060%), White/Caucasian (8.4%, a difference of 0.28%), and Barbadian (8.3%, a difference of 0.54%). Similarly, the demographic groups most similar to German Russians are Immigrants from Western Africa (8.2%, a difference of 0.040%), Immigrants from Sierra Leone (8.2%, a difference of 0.13%), Nigerian (8.2%, a difference of 0.14%), Central American (8.2%, a difference of 0.28%), and Guyanese (8.2%, a difference of 0.31%).
| Demographics | Rating | Rank | Unemployment Among Women with Children Under 6 years |
| French | 1.7 /100 | #244 | Tragic 8.2% |
| Native Hawaiians | 1.7 /100 | #245 | Tragic 8.2% |
| Central Americans | 1.4 /100 | #246 | Tragic 8.2% |
| German Russians | 1.2 /100 | #247 | Tragic 8.2% |
| Immigrants | Western Africa | 1.1 /100 | #248 | Tragic 8.2% |
| Immigrants | Sierra Leone | 1.1 /100 | #249 | Tragic 8.2% |
| Nigerians | 1.1 /100 | #250 | Tragic 8.2% |
| Guyanese | 1.0 /100 | #251 | Tragic 8.2% |
| Ghanaians | 1.0 /100 | #252 | Tragic 8.2% |
| Immigrants | Guyana | 0.8 /100 | #253 | Tragic 8.2% |
| Immigrants | Caribbean | 0.7 /100 | #254 | Tragic 8.3% |
| Immigrants | Portugal | 0.6 /100 | #255 | Tragic 8.3% |
| Celtics | 0.6 /100 | #256 | Tragic 8.3% |
| British West Indians | 0.5 /100 | #257 | Tragic 8.3% |
| Immigrants | Ghana | 0.5 /100 | #258 | Tragic 8.3% |
| Barbadians | 0.4 /100 | #259 | Tragic 8.3% |
| Whites/Caucasians | 0.3 /100 | #260 | Tragic 8.4% |
| Immigrants | Liberia | 0.3 /100 | #261 | Tragic 8.4% |
| West Indians | 0.3 /100 | #262 | Tragic 8.4% |
| Scotch-Irish | 0.3 /100 | #263 | Tragic 8.4% |
| Hondurans | 0.3 /100 | #264 | Tragic 8.4% |