Immigrants from South Africa vs German Russian Median Female Earnings
COMPARE
Immigrants from South Africa
German Russian
Median Female Earnings
Median Female Earnings Comparison
Immigrants from South Africa
German Russians
$42,508
MEDIAN FEMALE EARNINGS
99.7/ 100
METRIC RATING
74th/ 347
METRIC RANK
$37,105
MEDIAN FEMALE EARNINGS
0.5/ 100
METRIC RATING
263rd/ 347
METRIC RANK
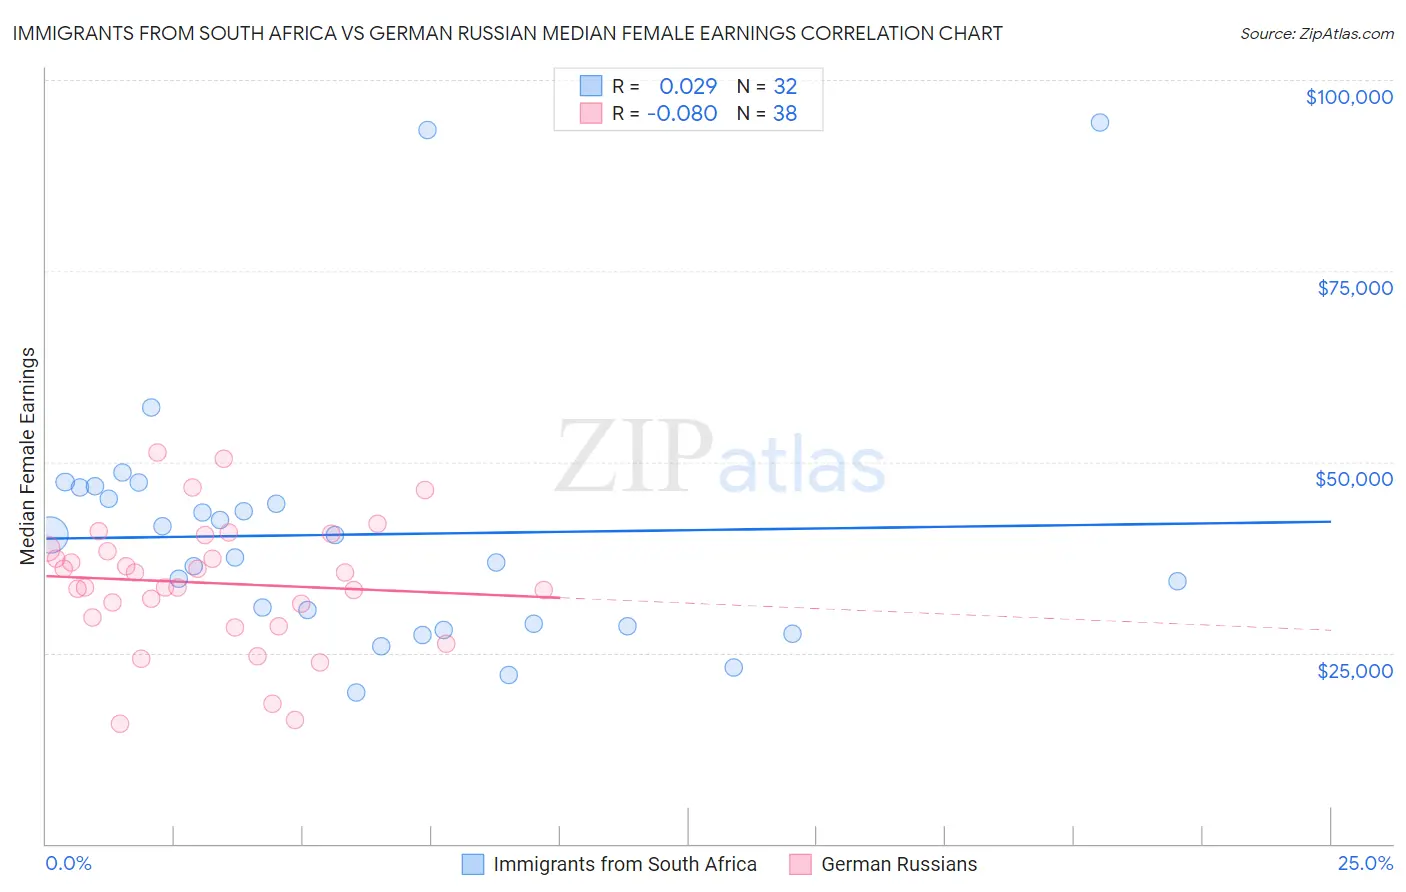
Immigrants from South Africa vs German Russian Median Female Earnings Correlation Chart
The statistical analysis conducted on geographies consisting of 233,273,838 people shows no correlation between the proportion of Immigrants from South Africa and median female earnings in the United States with a correlation coefficient (R) of 0.029 and weighted average of $42,508. Similarly, the statistical analysis conducted on geographies consisting of 96,453,013 people shows a slight negative correlation between the proportion of German Russians and median female earnings in the United States with a correlation coefficient (R) of -0.080 and weighted average of $37,105, a difference of 14.6%.
Median Female Earnings Correlation Summary
| Measurement | Immigrants from South Africa | German Russian |
| Minimum | $19,821 | $15,652 |
| Maximum | $94,510 | $51,256 |
| Range | $74,689 | $35,604 |
| Mean | $40,489 | $34,138 |
| Median | $38,975 | $34,536 |
| Interquartile 25% (IQ1) | $28,607 | $29,635 |
| Interquartile 75% (IQ3) | $45,877 | $38,614 |
| Interquartile Range (IQR) | $17,270 | $8,979 |
| Standard Deviation (Sample) | $16,714 | $8,300 |
| Standard Deviation (Population) | $16,451 | $8,190 |
Similar Demographics by Median Female Earnings
Demographics Similar to Immigrants from South Africa by Median Female Earnings
In terms of median female earnings, the demographic groups most similar to Immigrants from South Africa are Mongolian ($42,542, a difference of 0.080%), New Zealander ($42,446, a difference of 0.15%), Immigrants from Italy ($42,446, a difference of 0.15%), Albanian ($42,584, a difference of 0.18%), and Immigrants from Albania ($42,388, a difference of 0.28%).
| Demographics | Rating | Rank | Median Female Earnings |
| Immigrants | Egypt | 99.9 /100 | #67 | Exceptional $42,837 |
| Immigrants | Austria | 99.8 /100 | #68 | Exceptional $42,824 |
| Immigrants | Spain | 99.8 /100 | #69 | Exceptional $42,815 |
| Immigrants | Ethiopia | 99.8 /100 | #70 | Exceptional $42,744 |
| Immigrants | Romania | 99.8 /100 | #71 | Exceptional $42,718 |
| Albanians | 99.8 /100 | #72 | Exceptional $42,584 |
| Mongolians | 99.7 /100 | #73 | Exceptional $42,542 |
| Immigrants | South Africa | 99.7 /100 | #74 | Exceptional $42,508 |
| New Zealanders | 99.7 /100 | #75 | Exceptional $42,446 |
| Immigrants | Italy | 99.7 /100 | #76 | Exceptional $42,446 |
| Immigrants | Albania | 99.6 /100 | #77 | Exceptional $42,388 |
| Immigrants | Kazakhstan | 99.6 /100 | #78 | Exceptional $42,386 |
| Greeks | 99.6 /100 | #79 | Exceptional $42,336 |
| Immigrants | Moldova | 99.6 /100 | #80 | Exceptional $42,304 |
| Immigrants | Southern Europe | 99.5 /100 | #81 | Exceptional $42,275 |
Demographics Similar to German Russians by Median Female Earnings
In terms of median female earnings, the demographic groups most similar to German Russians are Salvadoran ($37,083, a difference of 0.060%), Immigrants from Belize ($37,056, a difference of 0.13%), Dominican ($37,046, a difference of 0.16%), Nonimmigrants ($37,024, a difference of 0.22%), and Cree ($37,018, a difference of 0.24%).
| Demographics | Rating | Rank | Median Female Earnings |
| Samoans | 1.0 /100 | #256 | Tragic $37,498 |
| Hawaiians | 1.0 /100 | #257 | Tragic $37,497 |
| Belizeans | 0.9 /100 | #258 | Tragic $37,429 |
| Scotch-Irish | 0.8 /100 | #259 | Tragic $37,383 |
| Dutch | 0.7 /100 | #260 | Tragic $37,339 |
| Malaysians | 0.7 /100 | #261 | Tragic $37,298 |
| Venezuelans | 0.7 /100 | #262 | Tragic $37,282 |
| German Russians | 0.5 /100 | #263 | Tragic $37,105 |
| Salvadorans | 0.4 /100 | #264 | Tragic $37,083 |
| Immigrants | Belize | 0.4 /100 | #265 | Tragic $37,056 |
| Dominicans | 0.4 /100 | #266 | Tragic $37,046 |
| Immigrants | Nonimmigrants | 0.4 /100 | #267 | Tragic $37,024 |
| Cree | 0.4 /100 | #268 | Tragic $37,018 |
| Immigrants | Venezuela | 0.4 /100 | #269 | Tragic $37,003 |
| French American Indians | 0.3 /100 | #270 | Tragic $36,920 |