Jamaican vs German Russian Median Female Earnings
COMPARE
Jamaican
German Russian
Median Female Earnings
Median Female Earnings Comparison
Jamaicans
German Russians
$38,670
MEDIAN FEMALE EARNINGS
10.5/ 100
METRIC RATING
213th/ 347
METRIC RANK
$37,105
MEDIAN FEMALE EARNINGS
0.5/ 100
METRIC RATING
263rd/ 347
METRIC RANK
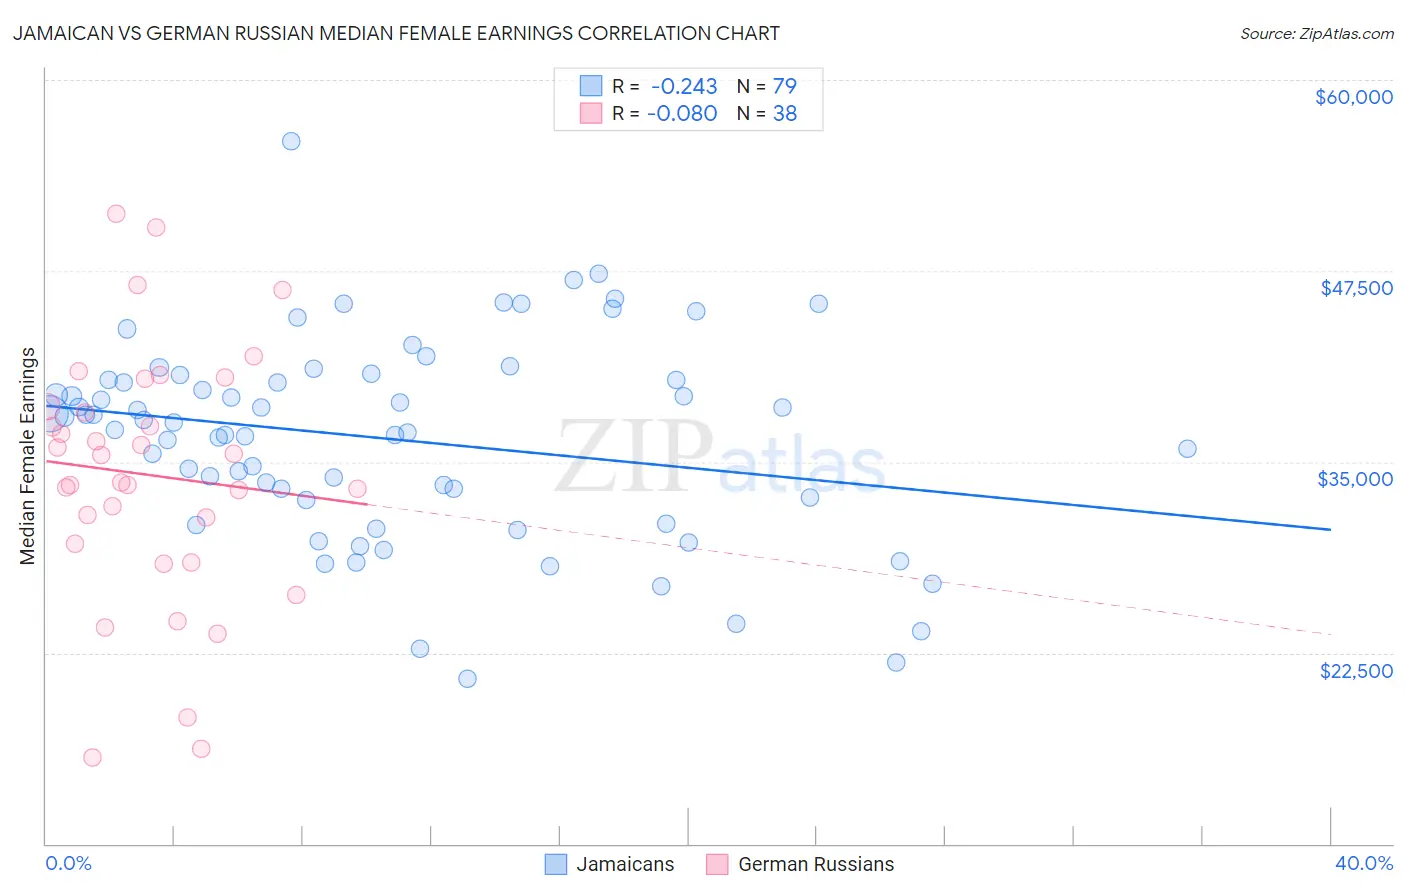
Jamaican vs German Russian Median Female Earnings Correlation Chart
The statistical analysis conducted on geographies consisting of 367,929,945 people shows a weak negative correlation between the proportion of Jamaicans and median female earnings in the United States with a correlation coefficient (R) of -0.243 and weighted average of $38,670. Similarly, the statistical analysis conducted on geographies consisting of 96,453,013 people shows a slight negative correlation between the proportion of German Russians and median female earnings in the United States with a correlation coefficient (R) of -0.080 and weighted average of $37,105, a difference of 4.2%.
Median Female Earnings Correlation Summary
| Measurement | Jamaican | German Russian |
| Minimum | $20,833 | $15,652 |
| Maximum | $56,012 | $51,256 |
| Range | $35,179 | $35,604 |
| Mean | $36,507 | $34,138 |
| Median | $37,552 | $34,536 |
| Interquartile 25% (IQ1) | $32,539 | $29,635 |
| Interquartile 75% (IQ3) | $40,387 | $38,614 |
| Interquartile Range (IQR) | $7,848 | $8,979 |
| Standard Deviation (Sample) | $6,597 | $8,300 |
| Standard Deviation (Population) | $6,555 | $8,190 |
Similar Demographics by Median Female Earnings
Demographics Similar to Jamaicans by Median Female Earnings
In terms of median female earnings, the demographic groups most similar to Jamaicans are Iraqi ($38,666, a difference of 0.010%), Spaniard ($38,656, a difference of 0.030%), Immigrants from Ecuador ($38,644, a difference of 0.070%), Guamanian/Chamorro ($38,717, a difference of 0.12%), and Immigrants from Jamaica ($38,625, a difference of 0.12%).
| Demographics | Rating | Rank | Median Female Earnings |
| Immigrants | Bosnia and Herzegovina | 15.6 /100 | #206 | Poor $38,886 |
| Immigrants | Cambodia | 14.2 /100 | #207 | Poor $38,833 |
| Immigrants | Thailand | 13.6 /100 | #208 | Poor $38,810 |
| Norwegians | 13.4 /100 | #209 | Poor $38,802 |
| Czechoslovakians | 12.0 /100 | #210 | Poor $38,738 |
| Aleuts | 11.6 /100 | #211 | Poor $38,719 |
| Guamanians/Chamorros | 11.5 /100 | #212 | Poor $38,717 |
| Jamaicans | 10.5 /100 | #213 | Poor $38,670 |
| Iraqis | 10.5 /100 | #214 | Poor $38,666 |
| Spaniards | 10.3 /100 | #215 | Poor $38,656 |
| Immigrants | Ecuador | 10.1 /100 | #216 | Poor $38,644 |
| Immigrants | Jamaica | 9.7 /100 | #217 | Tragic $38,625 |
| Cape Verdeans | 9.5 /100 | #218 | Tragic $38,614 |
| Nepalese | 9.3 /100 | #219 | Tragic $38,603 |
| Yugoslavians | 8.8 /100 | #220 | Tragic $38,573 |
Demographics Similar to German Russians by Median Female Earnings
In terms of median female earnings, the demographic groups most similar to German Russians are Salvadoran ($37,083, a difference of 0.060%), Immigrants from Belize ($37,056, a difference of 0.13%), Dominican ($37,046, a difference of 0.16%), Nonimmigrants ($37,024, a difference of 0.22%), and Cree ($37,018, a difference of 0.24%).
| Demographics | Rating | Rank | Median Female Earnings |
| Samoans | 1.0 /100 | #256 | Tragic $37,498 |
| Hawaiians | 1.0 /100 | #257 | Tragic $37,497 |
| Belizeans | 0.9 /100 | #258 | Tragic $37,429 |
| Scotch-Irish | 0.8 /100 | #259 | Tragic $37,383 |
| Dutch | 0.7 /100 | #260 | Tragic $37,339 |
| Malaysians | 0.7 /100 | #261 | Tragic $37,298 |
| Venezuelans | 0.7 /100 | #262 | Tragic $37,282 |
| German Russians | 0.5 /100 | #263 | Tragic $37,105 |
| Salvadorans | 0.4 /100 | #264 | Tragic $37,083 |
| Immigrants | Belize | 0.4 /100 | #265 | Tragic $37,056 |
| Dominicans | 0.4 /100 | #266 | Tragic $37,046 |
| Immigrants | Nonimmigrants | 0.4 /100 | #267 | Tragic $37,024 |
| Cree | 0.4 /100 | #268 | Tragic $37,018 |
| Immigrants | Venezuela | 0.4 /100 | #269 | Tragic $37,003 |
| French American Indians | 0.3 /100 | #270 | Tragic $36,920 |